
The first part of this tutorial is uploaded here. Click here to watch the video that goes with these tutorials.
I. Table Relationships
Now that we have the DB tables from the sakila metadata, it’s time to connect them in a way that mirrors their relationship in the actual MySQL database.
We read the relationships metadata with the helper method in the DBMetaData class:
ArrayList relations = DBMetaData.getRelationsMetadata(tables);
The method returns a list of our custom DBRelation objects, where each one contains data about two related tables and their fields.
TableNode source = (TableNode)diagram.findNodeById(relation.pk_table);
TableNode destination = (TableNode)diagram.findNodeById(relation.fk_table);
The DBRelation object provides the fields that enter into relation as strings. Since the Diagram.Factor.createDiagramLink method requires the indices of the DB rows we must identify them:
 for(int i = 0; i < rowCount; i++)
    {
         Cell cell = source.getCell(1, i);

         if(cell.getText().equals("" + relation.pk_key + ""))
           {
               pk_index = i;
               break;
            }
     }
Now that we have identified the indexes of the fields that actually relate to each other in both the source and destination tables, we can connect them:
DiagramLink link = diagram.getFactory().createDiagramLink(source, pk_index, destination, fk_index);
We use the capability of the Java diagram library to connect table nodes not generally but a specific row to another specific row.
We also make some visual customizations to make the connectors look more DB-like:
link.setBaseShape(ArrowHeads.RevWithLine);
link.setBaseShapeSize(3f);
link.setHeadShapeSize(3f);
link.setShape(LinkShape.Cascading);
For those rows, that are foreign keys but are not primary keys we add an icon:
try {
    File pathToFile = new File("res/fkey.png");
    Image image = ImageIO.read(pathToFile);
    if(fk_index > -1 && destination.getCell(0,fk_index).getImage() == null)
           destination.getCell(0,fk_index).setImage(image);
    } catch (IOException ex) {
         ex.printStackTrace();
}
Here is what we have achieved so far:
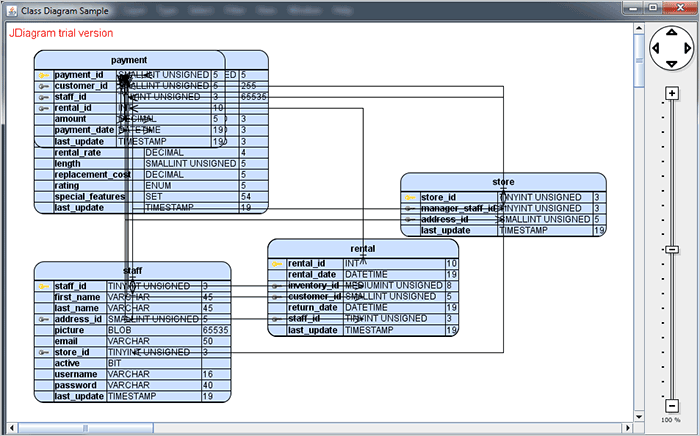
The diagram is ready but needs a proper layout
II. Layout
Arranging such DB schema might be a challenging task when done manually but we’ll combine the impressive layout algorithms and arrangement features of the library to arrange the diagram 100% automatically.
A horizontal LayeredLayout provides a nice start. We specify the distance between the layers in the diagram and the nodes – the first two parameters. The last two are the left and top offset of the diagram from the edge of the document.
The diagram links can be arranged by a separate algorithm and we use this feature to polish the way they go around the tables.
 //re-route all links
 diagram.setLinkRouter(new GridRouter());
 diagram.routeAllLinks();
Another useful option is to render link crossings with arcs, which makes them much easier to follow.
//customize the links
diagram.setLinkCrossings(LinkCrossings.Arcs);
diagram.setRoundedLinks(true);
diagram.setRoundedLinksRadius(3);
Finally, the diagram must be updated:
//redraw the control
diagram.repaint();
With that our diagram is finished and it looks great:
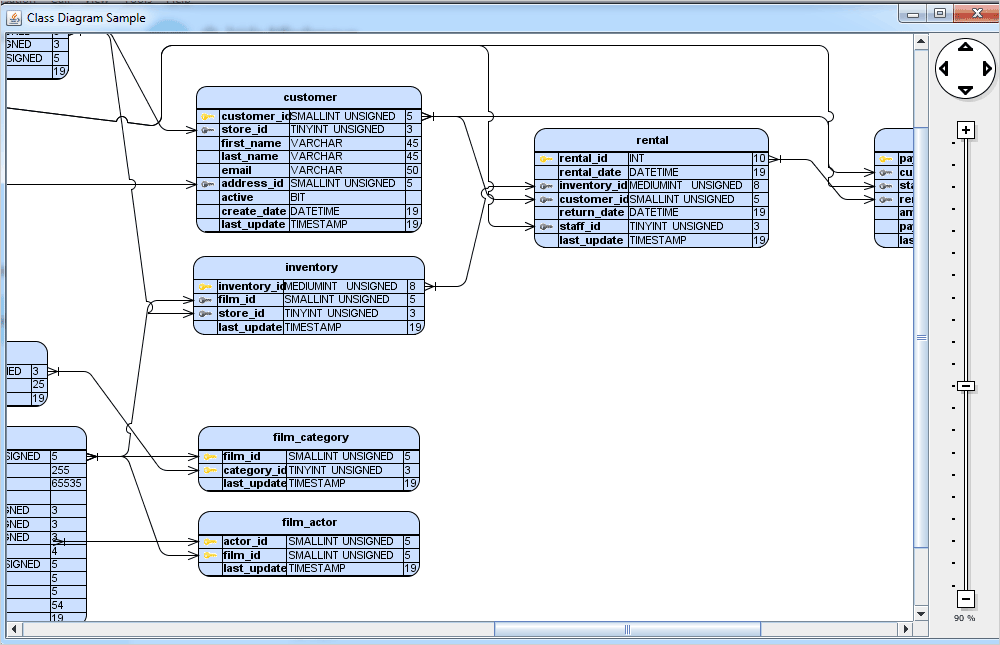
The final version of the diagram.
You can download the complete sample from this link. The sample contains the sakila MySQL database with a PDF file with instructions how to install it if you haven’t already. You will need to have an installed and running MySQL server. Remember to change the login data in the DBConnection.java file to match your login credentials.
About Diagramming for Java Swing: MindFusion.Diagramming for Java Swing provides your Java application with all necessary functionality to create and customize a diagram. The library is very easy to integrate and program. There are numerous utility methods, rich event set, more than 100 predefined shapes. The tool supports a variety of ways to render or export the diagram, advanced node types like TreeView nodes, hierarchical nodes, tables, container nodes and many more. There are 15 automatic layouts, various input / output options and fully customizable appearance. A detailed list with JDiagram’s features is uploaded here. You can check the online demo to see some of the functionality implemented.
Diagramming for Java Swing is royalty free, there are no distribution fees. Licenses depend on the count of developers using the tool – check here the prices.