Diagramming for ASP.NET, V5.1

The new version of Diagramming for ASP.NET programming component has just been released. Here is an overview of the most important new features:

Canvas mode improvements

  • undo / redo support: call diagram.setUndoEnabled(true) on client side to start tracking changes.
    Call undo() or redo() methods to restore diagram state. Actions cannot be undone after postback;
  • animations: the Animation JavaScript class can be used to animate values of various properties of
    nodes and links. An example is available at http://mindfusion.eu/_samples/animations/Animations.html
  • clipboard support: call the copyToClipboard, cutToClipboard and pasteFromClipboard methods to copy or paste selected items;
  • the swimlane grid is now rendered in Canvas mode;
  • the magnifier tool is now supported in Canvas mode;
  • as well other new properties and events – check them here.
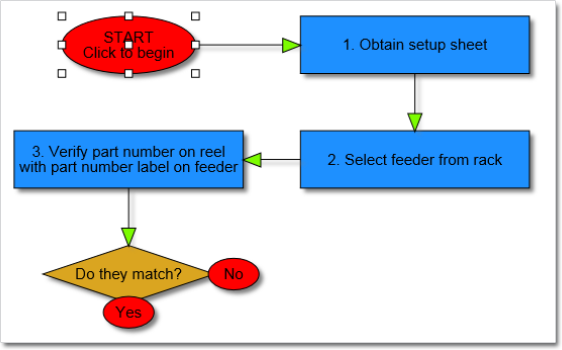
A typical flowchart built interactively. Some of the nodes support animation. See the sample here.

A typical flowchart built interactively. Some of the nodes support animation. See the sample here.

Intellisense support
The package now includes a MindFusion.Diagramming-vsdoc.js file providing code completion information. To load it in Visual Studio, add e /// tag to the top of your script files. Use the static Diagram.create and Diagram.find methods instead of $create and $find to let Visual Studio infer the type of returned Diagram objects correctly.

Node list control
The NodeListView control is a listbox control that can host any type of objects that derive from DiagramNode. Users can drag objects from the NodeListView onto the Diagram canvas. The control creates a copy of the selected node at the position of the mouse pointer.

Resize of multiple nodes
The new AllowMultipleResize property lets users resize multipleselected nodes simultaneously. When enabled, dragging the corner or side adjustment handle of any node resizes all nodes in the selection.

Export of Visio 2013 files
You can export the content of Diagram and DiagramDocument objects to Visio 2013 VSDX files. First, you should add a reference to the MindFusion.Diagramming.Export.Visio.dll assembly. Currently, the exporter supports shapes from the Visio basic stencil. Support for more shapes will be added upon request.

Improvements in the Visio2013Importer

  • The importer now supports Visio group shapes. Child shapes in groups are no longer lost when importing, and their corresponding diagram nodes are attached to the corresponding group node.
  • Visio NURBS curves are now imported as Bezier-style links.
  • and more – check them here.

Headers and footers in PDF
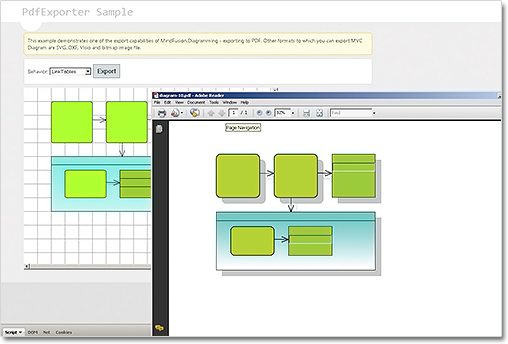
The PdfExporter can now add headers and footers to the exported pages. Their contents and font are customizable.

The PdfExporter

The PdfExporter

Detailed information about the release is posted at the forum. Below is a link to download the trial version:

Download MindFusion.Diagramming for ASP.NET 5.1 Trial Version

Technical support
MindFusion support team is happy to assist you with any questions you might have about Diagramming for ASP.NET or any other of our products. You can leave a message at the discussion board, use the help desk or e-mail support@mindfusion.eu.. We strive to provide competent and detailed answers to your questions within hours of receiving them.

About Diagramming for ASP.NET: An advanced WebForms programming component that offers all the functionality that is needed for creating, styling and presenting attractive flowcharts, hierarchies, trees, graphs, schemes, diagrams and many more. The control offers numerous utility methods, path finding and cycle detection, rich event set and many useful user interaction features like tool tips, multiple selection, copy/paste to/from Windows clipboard and many more.

NetDiagram offers more than 100 predefined node shapes, scrollable tables, 13 automatic layouts and many
more. You can check the online demo to see some of the features in action. The control includes many samples, detailed documentation and step-by-step tutorials. Every features is duly documented and there’s plenty of code to copy. The component is not only powerful and scalable, but easy to learn and fun to use.

Diagramming for JavaScript, V2.0

We have released Diagramming for JavaScript with a host of new features. Here is an overview:

Undo / redo support
If you set the UndoEnabled property to true, the Diagram control tracks changes done to its items and allows undoing and redoing them later by calling the undo() and redo() methods respectively. Multiple changes could be recorded as a single undoable operation by enclosing them between startCompositeOperation() and commitCompositeOperation() calls. You can also create custom undoable operations.

Animations
You can animate Diagram items through the Animation class in the MindFusion.Animations namespace. The class
implements several built-in animation and easing types, and allows definition of custom animation functions, to create fluid and pleasing animation effects.

Clipboard support
Now you can copy or cut a single item or a selection of items to a clipboard maintained by the diagram control. This is done programmatically using the copyToClipboard and cutToClipboard methods. To paste the clipboard contents into the current diagram, call pasteFromClipboard.

Swimlanes
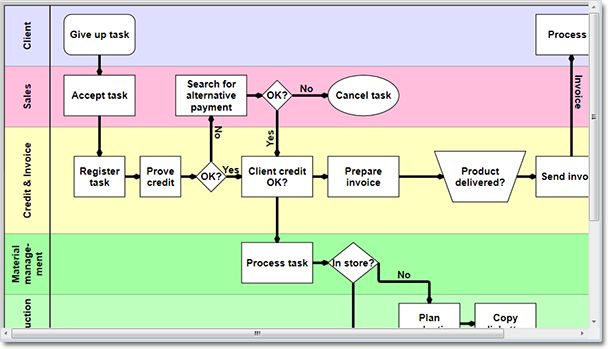
The lane grid lets you emphasize the relationship between a group of diagram items by displaying them in a distinct lane or cell within the grid. If you want to display the lane grid, set the EnableLanes property of the Diagram class to true. In order to customize the grid, set the various attributes exposed by the LaneGrid property, which lets you specify the number of rows and columns, add headers, customize the cell appearance, etc.

A diagram with swimlanes.

A diagram with swimlanes.

Resize of multiple nodes
You can now resize multiple selected nodes simultaneously – just set the AllowMultipleResize property to true. When enabled, dragging a corner or side adjustment handle of any node resizes all nodes in the selection. The selectionModifying validation event lets you cancel the operation for all nodes.

Magnifier
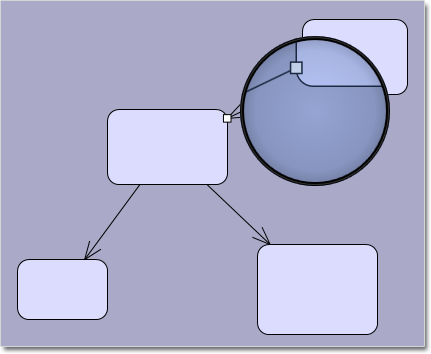
The new magnifier tool allows users to interactively zoom in (or out) portions of the diagram by holding down a modifier key or pressing a mouse button. You can customize the magnifier’s appearance via properties such as MagnifierShape and MagnifierFrameColor. Its size and magnification can be set via MagnifierWidth, MagnifierHeight and MagnifierFactor properties.

The new magnifier tool.

The new magnifier tool.

Intellisense support
The package now includes a MindFusion.Diagramming-vsdoc.js file providing code completion information. To load it in Visual Studio, add e /// <reference path=”MindFusion.Diagramming-vsdoc.js” /> tag to the top of your script files. Use the static Diagram.create and Diagram.find methods instead of $create and $find to let Visual Studio infer the type of returned Diagram objects correctly.

Miscellaneous

  • Set the ModificationStart property to AutoHandles to let users start moving or resizing an item without selecting it first.
  • The diagram area can be resized automatically to fit the current diagram items as set through the AutoResize property.
  • The AutoScroll property enables automatic scrolling when the mouse is dragged near the diagram edges.
  • And much more. Read the full list here.

The trial version of the new Diagramming for JavaScript release is available for direct download from the following link:

Download MindFusion.Diagramming for JavaScript Library 2.0 Trial Version

We have always taken special effort in providing quality technical support to all our clients and evaluators. You can write us at e-mail support@mindfusion.eu or use the help desk. You can use the JsDiagram section on MindFusion forum to post questions about the tool.

About Diagramming for JavaScript Library: Written 100% in JavaScript, this tool uses HTML5 Canvas to draw impressive diagrams, schemes, flowcharts, trees and many more. It is browser independent, easy to use and integrate into any web application. JsDiagram supports a variety of predefined node shapes, customizable links, rich event set and many appearance options. The user interaction model includes resizing / moving / selecting and modifying any diagram element.

The tool boasts an elegant API, which is documented in details as well numerous step-by-step guides and tutorials. Various samples are provided to let you learn quickly how to use the most important features of the library – check them here. JsDiagram is not only the perfect choice for creating any type of diagram in the browser – it can also arrange it the way you wish with a mouse click using one of its automatic graph layout algorithms. For more details about the features of the component, please visit the JsDiagram page.