Here is a link to Part I: Overview of chart elements, the dashboard, plot and axes.
I. Bars Rendering
The bar graphics is rendered by a BarStackRenderer. It requires a collection of Series and we add four:
private ObservableList createSeries()
   {
      // Important series
	BarSeries series1 = new BarSeries(
	Arrays.asList(40.0, 30.0, 52.0, 62.0),
	Arrays.asList("20%", "15%", "26%", "31%"),
	null /* no top labels */);

        ............

  }
Each BarSeries has a list with the data, a list with the inner labels and no top labels. The BarStackRenderer renders in a single bar the values from the same index in each BarSeries e.g. the first bar renders the first double value in all BarSeries, the second bar renders the values on the second position in the series and so on. The BarRenderer itself has a few customizations:
barRenderer = new BarStackRenderer (createSeries());
barRenderer.setHorizontalBars(true);
barRenderer.setBarSpacingRatio(0.3);
barRenderer.setYAxis(yAxis);
barRenderer.setXAxis(xAxis);
barRenderer.setShowDataLabels(EnumSet.of(LabelKinds.InnerLabel));
barRenderer.setLabelFontSize(12.0);
Let’s not forget to add it to the Plot2D:
plot.getSeriesRenderers().add(barRenderer);
II. The Annotations
The labels at the X and Y axis are actually annotations – they are created by AnnotationRenderer instances. An AnnotationRenderer needs a collection of Series. For the Y-axis we use a SimpleSeries instance, which is created and used for the annotations and does not provide data for the bars:
private ObservableList createAxisLabels()
{
   return FXCollections.observableList(Arrays.asList(
	new SimpleSeries(null, null)
	{
        	public String getLabel(int index, LabelKinds kind)
		{
			return axisLabels[index];
		}

		public double getValue(int index, int dimension) { return index; }

		public int getSize() { return axisLabels.length; }

		public int getDimensions() { return 1; }

		public EnumSet getSupportedLabels() {
	        	return EnumSet.of(LabelKinds.YAxisLabel);
		}

		final String[] axisLabels = {
			"Accomodation", "University\nLocation", "Tuition\nPrice", "Quality of\nEducation" };
		}
	));
}
Here we indicate that this SimpleSeries provides labels for the YAxis with the getSupportedLabels override, which in our case returns LabelKinds.YAxisLabel. The label is returned by the getLabel method.
The annotations on the X-axis are rendered by a special class called CustomBarSeries. We implement the Series interface to return a set of predefined labels for each data value in this series:
public CustomBarSeries(List values, List innerLabels, List topLabels) {
	super(values, innerLabels, topLabels);

	this._values = values;
	double sum = 0;
	_stackedValues = new ArrayList(values.size());

	for(double val : values)
	{
	   sum += val;
	  _stackedValues.add(sum);
	}
	this._innerLabels = innerLabels;

}
We also take into consideration that the values rendered by the bar chart where this class is used are stacked – so we sum them and return the summed value when asked:
public double getValue(int index, int dimension) {

	if( dimension == 0)
	  return _stackedValues.get(index);

        return _values.get(index);
}
Then we return the predefined label at the given position and :
public String getLabel(int index, LabelKinds kind)
  {
	if(kind.equals(LabelKinds.InnerLabel))
	{
		return _innerLabels.get(index);
	}

	//else return the labels
	return axisLabels[index];
}

       final String[] axisLabels = {
		"Very Important",
		"Somewhat\nImportant", "Slightly\nImportant",
		"Not\nImportant" };
We create an instance of this CustomBarSeries and we assign it to the new AnnotationRenderer, that is responsible for the labels at the X-axis:
List sl = new ArrayList();
	sl.add(new CustomBarSeries(
	        Arrays.asList(25.0, 50.0, 50.0, 50.0),
		null,
		null));
	javafx.collections.ObservableList olss = FXCollections.observableList(sl);
	annotationRenderer1 = new AnnotationRenderer(olss);
	annotationRenderer1.setSeries(olss);
Let’s not forget to bind the AnnotationRenderer to the X-axis:
annotationRenderer1.setXAxis(xAxis);
annotationRenderer1.setShowDataLabels(EnumSet.of(LabelKinds.XAxisLabel));
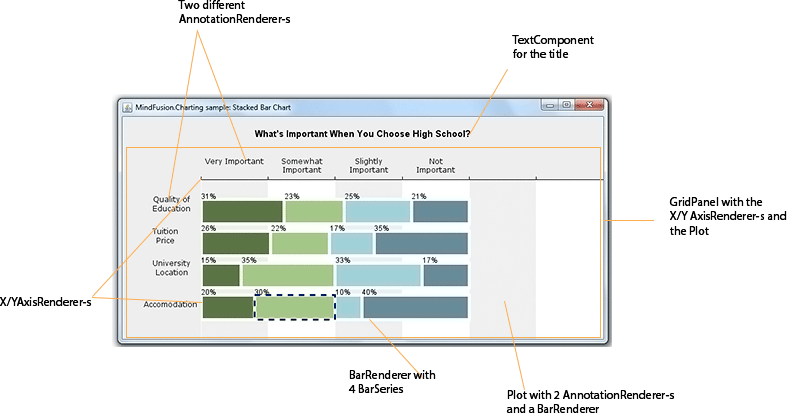
Here is the final chart:
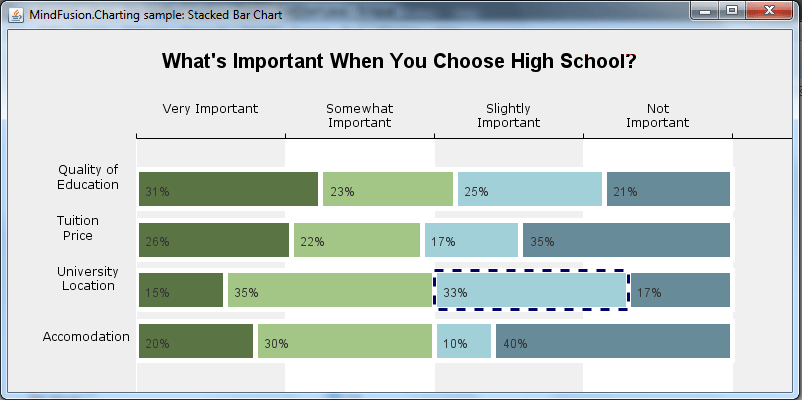
Poll chart in Java Swing
That’s the end of this tutorial. Here is the link to download the full sample.
Download The Stacked Bar Chart in Java Sample
About Charting for Java: MindFusion.Charting for Java Swing is a multipurpose graphics library that lets you create and customize a large variety of chart types: bar, column, pie, doughnut, radar, polar etc., candlestick financial charts, gauges and dashboards with dynamic layout of their components. The library boasts a smart API which lets you combine and arrange multiple lots, axes, legends, images and other chart components. The chart appearance can be customized on multiple levels – from properties applied on a single element to global themes reused by all charts and series. Charts use a uniform Series interface for reading data and labels. You can implement the interface and create custom Series that matches your data source. Written in pure Java, this tool provides every type of Java Swing application with powerful charting capabilities. Read more about the component from here.