MindFusion has released its Pack for WPF 2014.R1. Here is an overview of the new features:
Support for Visual Studio 2013
The installer can create a toolbox palette in VS2013 for the components and optionally installs VS2013 sample projects.
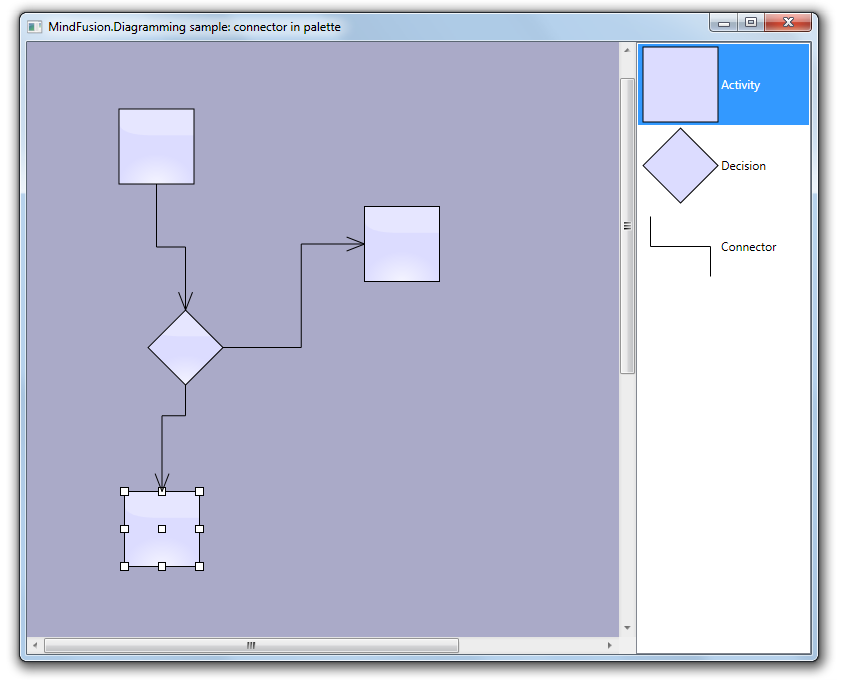
![]() MindFusion.Diagramming
MindFusion.Diagramming
Import of Visio 2013 files
The new Visio2013Importer class can import *.vsdx files, which were created with Microsoft Visio 2013. The importer requires a reference to the MindFusion.Diagramming.Wpf.VisioImport.dll assembly. You can use the various overloads of the Import method to import the Visio drawing into a DiagramDocument, whose pages correspond to the Visio pages or into a single Diagram, whose content
is merged from all important pages.
Zoom control
The ZoomControl class lets the users change interactively the current zoom level and scroll position of a Diagram or DiagramView. In order to use it, you should add a Zoom control to the window, place it anywhere over the target diagram and set the control’s Target property to that diagram or view. The Zoom control offers numerous customization properties.
Miscellaneous
- Enable the AllowRenamePages property of TabbedDiagramView to let users rename a DiagramPage interactively by clicking on its tab.
- Several new shapes added for better compatibility with Visio 2013 basic stencil: RightTriangle, Decagon, Trapezoid, Star4Pointed, Star5Pointed, Star6Pointed, Star7Pointed, Star16Pointed, Star24Pointed, Star32Pointed, Donut, Plaque.
- DefaultEncoding and AutoDetectEncoding properties added to PdfExporter.
- and much more.
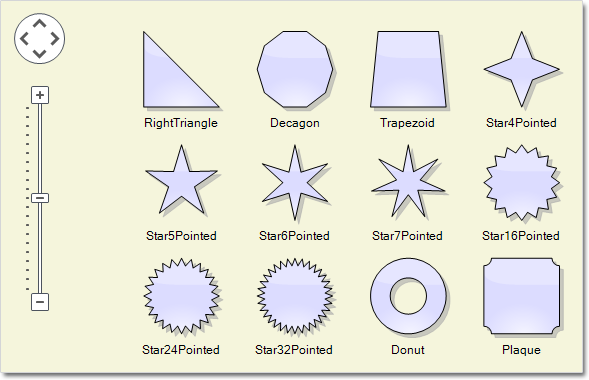
The Zoom control and the new predefined shape nodes
You can read details about the new features of the pack at the news page on the forum. The trial version is available for direct download from this link:
Download MindFusion.Pack for WPF 2014.R1
About MindFusion.Wpf Pack: A set of advanced WPF components that help you build your business application easy and on time. The tools provide you with a complete set of features to create, edit and render complex flowcharts, charts, diagrams, calendars, schedules, maps and reports. A set of gauges and UI elements is also included. Each component offers various samples, tutorials and detailed documentation. The controls offer simple and intuitive API, completely customizable appearance, numerous input/output options and a rich event set. Each tool has been thoroughly tested to guarantee that you and your application get the high quality and performance you deserve.
You can read more about the capabilities of each component at its features page:
- Charting for Wpf features page
- Gauges for Wpf features page
- Diagramming for Wpf features page
- Scheduling for Wpf features page
- Reporting for Wpf features page
- Mapping for Wpf features page
- UI for Wpf features page
Prices and licenses are explained in details at the buy page. We offer permanent discounts to certain types of commercial as well non commercial organizations – check here if you qualify.