MindFusion Charting for WinForms, V3.6

MindFusion has released a new version of its Charting for WinForms programming control. Here is an overview of the most important new features:

Custom Formatting of Labels
You can now use custom formatting for numeric labels for all chart types. The formatting is applied when you set the format of the label to NumberFormat.Custom. The properties that set the custom number format use the .net custom format strings.

Labels in a WinForms bar chart

Labels in a WinForms bar chart

Sorting of Bars
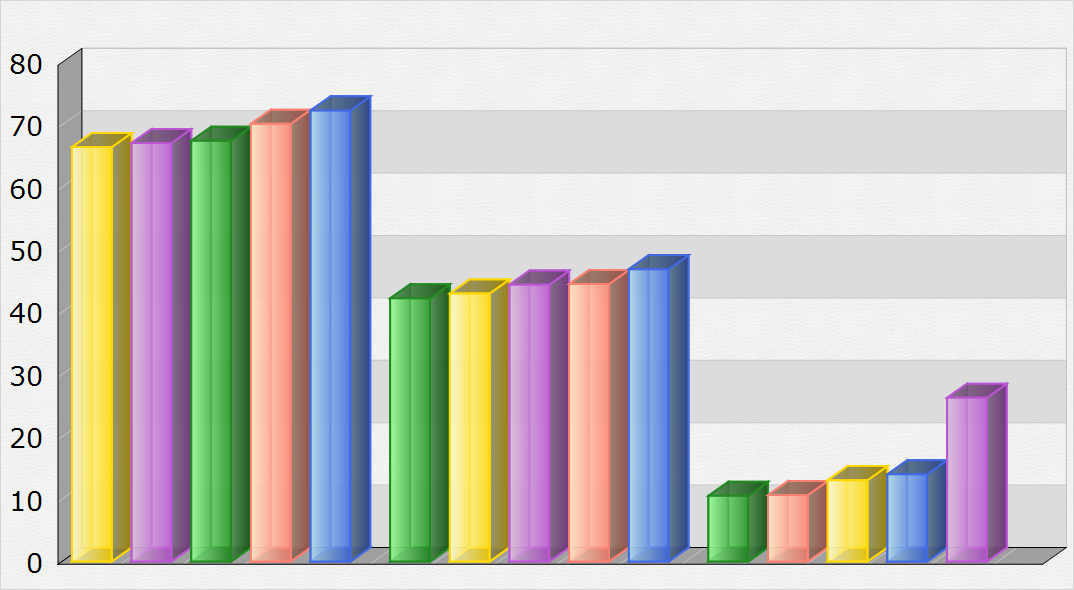
MindFusion WinFormsCharting control offers you greatly improved sorting of bar values in a bar chart. You can use the SortOrder property to sort the bars in each series or cluster in ascending or descending order. You can also sort each series/cluster with the SortSeriesBy property. You can preserve the color of each bar when sorted if you set the SortColor property to true.

A WinForms chart with sorted bars.

A WinForms chart with sorted bars.

License keys
MindFusion no longer provides separate trial and licensed versions of its components. Instead, you should set the LicenseKey property to disable the component’s evaluation mode and stop displaying trial messages. If your application has more than one Diagram instance or other controls by MindFusion, a single call to MindFusion.Licensing.LicenseManager.AddLicense(key) is enough to specify the key for all the controls. You can find your license key strings listed on the Keys & Downloads page at your http://clientsarea.eu account.

Miscellaneous

  • Bars are now outlined with the consecutive pen from the ChartPens collection rather than the AxisPen.
  • Drawing of line and area charts has greatly been improved – the control now draws only the visible portion of the chart rather than the whole chart, which was clipped to the visible rectangle.
  • AreaOpacity property added to radar charts.
  • AxesOnTop property in radar charts sets the order of drawing for the graphic and the axes.
  • SortYData and SortXData properties added to line charts.
  • In line charts colors can be sorted with line series or scatters when those get sorted.

The trial version is available for direct download from this link:

Download MindFusion.Charting for WinForms 3.6

Technical support is available at the forum, help desk or at e-mail support@mindfusion.eu. All inquiries are answered within hours of being received.

About MindFusion.Charting for WinForms: a professional programming component for WinForms, which lets you create remarkable charts fast and easy. The tool supports all major chart types – line, pie, radar and bar – and numerous variations of them – column, area, bubble, polar, doughnut etc. 3D charts are supported as well.

Charting for WinForms supports a rich user interaction model with features like zoom, hit testing, drill down, mouse dragging and more. You can use delegates to present mathematical functions, undefined values are also acceptable. Values can be data arrays or retrieved through a database.

The appearance of each chart is fully customizable. The control offers strong design-time support with custom collection editors and chart wizards. At your disposal is a set of predefined appearance themes and a theme editor tool. A full list of the features can be read here.

ASP.NET Bar Chart with Custom Labels

In this blog post we will look on how to build a bar chart with multiple series, custom X-labels and inner labels using MindFusion.Charting for ASP.NET control.

1. General Appearance of the Chart

We want to show three data series and we want to show the first values of each series in a cluster, then second cluster with the second values of each series etc. In order to render the bars in this order we set the BarType property to BarType.Clustered3D. We correct the Depth3D to make the bars less thick and increase the distance between each series with DistBtwBars. We make the bars wider, setting BarWidth to 30.

    //general appearance
    BarChart1.BarType = MindFusion.Charting.BarType.Clustered3D;
    BarChart1.BarWidth = 30f;        
    BarChart1.Depth3D = 15f;
    BarChart1.DistBtwBars = 10f;

2. Grid

Our bars are vertical e.g. it is a column chart, so we would like to have a horizontal grid. We set the GridType property to GridType.HorScale and we set the AltGridBrush and GridBruh to different gray colors to give us nice alternating grid stripes. For the outlining of the whole plot area we use the PlotAreaOutlinePen.

    //grid settings
    BarChart1.GridBrush= new MindFusion.Drawing.SolidBrush(System.Drawing.Color.FromArgb(242, 239, 224));
    BarChart1.GridPen= new MindFusion.Drawing.Pen(System.Drawing.Color.FromArgb(204, 196, 185));
    BarChart1.GridType = MindFusion.Charting.GridType.HorScale;
    BarChart1.PlotAreaOutlinePen = new MindFusion.Drawing.Pen(System.Drawing.Color.FromArgb(204, 196, 185));

3. Labels Inside Bars

The labels inside bars show the data of each bar – this is done by setting the InnerLabelType property to LabelType.Data. We use a white LabelBrush to draw the labels and set their InnerLabelBorder to Border.RoundedRect. The background of the inner labels is set to gray.

    //inner labels settings
    BarChart1.InnerLabelBackground = new MindFusion.Drawing.SolidBrush(System.Drawing.Color.FromArgb(112, 128, 144));
    BarChart1.InnerLabelBorder = MindFusion.Charting.Border.RoundedRect;
    BarChart1.InnerLabelType = MindFusion.Charting.LabelType.Data; 
    BarChart1.LabelBrush = new MindFusion.Drawing.SolidBrush(System.Drawing.Color.FromArgb(255, 255, 255));

4. Title

We want not only title but also second title – or a subtitle. That’s why we use both the TitleText and SubTitleText properties. We leave no distance between them – we set SubTitleOffset to 0. But we would like the two titles to be well above the plot area, that’s why we set bigger TitleOffset.

    //title and subtitle
    BarChart1.SubTitleOffset = 30;
    BarChart1.SubTitleText = "all major continents";
    BarChart1.TitleOffset = 0;
    BarChart1.TitleText = "Sales";

5. Labels at the Axes

The X-labels are custom text – we set them with XLabels. The title of the Y-axis is rotated, so we use LabelOrientation.BottomToTop.

    //axes labels settings
    BarChart1.XAxisSettings.LabelSeriesIndex = 1;
    BarChart1.XLabels.Clear();
    BarChart1.XLabels.Add(new List(){ "Europe", "Asia", "North America", "South America"});
    
    BarChart1.YAxisSettings.TitleLabel = "in mlns. USD";
    BarChart1.YAxisSettings.TitleLabelOrientation = MindFusion.Charting.LabelOrientation.BottomToTop;

Here is a screenshot of the final chart:

ASP.NET Bar Chart with Custom Labels

ASP.NET Bar Chart with Custom Labels

The sample can be downloaded from here:

Download ASP.NET Bar Chart with Labels Sample

The trial version of MindFusion.Charting for ASP.NET can be downloaded directly from the link below. It contains many more samples and tutorials:

Download MindFusion.Charting for WebForms Trial Version

About MindFusion.Charting for WebForms: A powerful WebForms control that lets programmers add compelling charts in any ASP.NET application. With the component you can design and create any bar, column, line, area, scatter, bubble, radar, polar, doughnut and pie chart. Its elegant API includes data binding, themes, hit-testing, zoom, drill-down, wizards and many more.

The control takes advantage of the rich capabilities of Microsoft WebForms but its functionality does not bring excess complexity. The API is very easy to understand, all the features are duly documented. Numerous samples and step-by-step tutorials let you learn quickly how to tailor the tool in order to meet best your needs.

Details about the various features of the control are provided here. The online demo will give you an overview of the control’s rich capabilities. Licenses, prices and discounts are listed at the buy page.