
In today’s post we are going to build a real time line chart with the following features:
- 8 data series with 100 points each.
- Ten times per second we add 10 random points to each series and remove the last ten.
- Each tenth of the second we update the min and max values of the X-axis.
- Legend
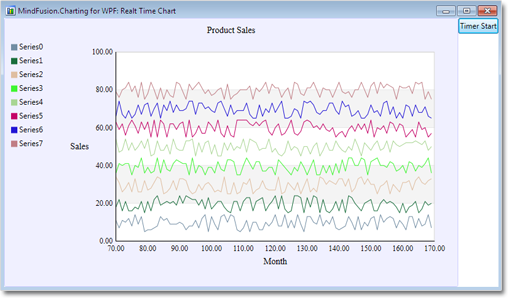
The final chart
Create the series
We create 8 series and add them to the Series collection of the chart:
for (int i = 0; i < 8; i++)
{
     LineSeries series = new LineSeries();
     series.StrokeThickness = 3;
     series.Strokes.Add(RandomStroke);
     series.Fills = series.Strokes;
     series.Title = "Series" + i;
     series.XData = new DoubleCollection();
     series.YData = new DoubleCollection();

     for (int j = 0; j < 100; j++)
     {
        series.XData.Add(j);
        series.YData.Add(10 + 10 * i + random.Next(-5, 5));
      }

     lineChart.Series.Add(series);
 }
Each series is drawn with a random generated stroke:
  private Brush RandomStroke
  {
     get
     {
        byte r = (byte)random.Next(0, 255);
        byte g = (byte)random.Next(0, 255);
        byte b = (byte)random.Next(0, 255);
        return new SolidColorBrush(Color.FromArgb(255, r, g, b));
       }
     }
We must set the Title and Fills properties though we don’t need them for the chart – they are used by the legend. The Y-values of the line points are random numbers between 10 and 90.
The Legend
ChartLegend legend = new ChartLegend();
legend.Series = lineChart.Series;
lineChart.Legends.Add(legend);
Our legend is of type ChartLegend, which means we must set its Series property to the list of ChartSeries that the legend explains. The ChartLegend reads the labels for its items from the Title property of a ChartSeries. It draws the series rectangles with the first brush in ChartSeries.Strokes and fills them with the first brush in ChartSeries.Fills. That’s why it was important to set the Title, Fills and Strokes properties as shown above.
The Axis
The axis shows scale divisions with interval 10. Initially they range from 0 to 100 in 10 intervals.
lineChart.XAxisSettings.MinValue = 0;
lineChart.XAxisSettings.Interval = 10;
lineChart.XAxisSettings.LabelType = LabelType.AutoScale;
Updating Data in Real Time
We create a timer that simulates reading real time data. The timer ticks ten times every second:
timer.Interval = TimeSpan.FromMilliseconds(100);
timer.Tick += new EventHandler(OnTimerTick);
When the timer ticks, we generate ten new values for each of the eight series, add them to each series and remove the last ten values:
foreach (LineSeries series in lineChart.Series)
{
    for (int i = 10 - 1; i >= 0; i--)
    {
         series.XData.Remove(series.XData[i]);
         series.YData.Remove(series.YData[i]);
    }
}

foreach (LineSeries series in lineChart.Series)
{
    int counter = 0;
    for (int i = 0; i < 10; i++)
    {
         series.XData.Add(i + maxX);
         series.YData.Add(10 + counter * 10 + random.Next(-5, 5));
     }
     counter++;
}
Here we use a global variable maxX, which we have declared in the class:
private int maxX = 100;
We increase our global variable with 10 to keep up with the change in the data:
maxX += 10;
Updating the Axis
At each tick of the timer we increase the start of the axis with 10:
lineChart.XAxisSettings.MinValue += 10;
Performance Optimization
Performance is greatly improved if we set the thickness of the lines to 1 rather than 3. The reason for this is that Windows GDI system draws thick lines by filling polygons. This requires numerous calculations about the coordinates of each polygon. When the thickness is small, Windows GDI draws lines rather than polygons, which speeds up drawing and performance.
series.StrokeThickness = 3;
Download of the Sample
You can download the sample with complete source code from here: