
We have just released version 1.8 of Diagramming for ASP.NET MVC programming component. Here is a list of the most important new features:
Rounded links
Links whose Shape is set to Polyline or Cascading can be rendered with rounded joints between segments – just set the Diagram.RoundedLinks property to true. You can specify the radius of joint arcs with the Diagram.RoundedLinks property.
Link crossings
The component can represent the crossing point of two links either as an arc (bridge) drawn for the link with higher Z-index or as a cut drawn in the link with lower Z index. To enable that, you must set the Diagram.LinkCrossings property to LinkCrossings.Arcs or LinkCrossings.Cut. You can specify the radius of crossing arcs with Diagram.CrossingRadius.
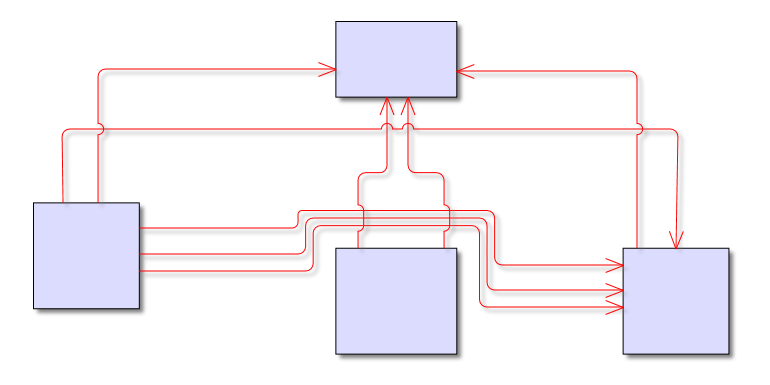
Arcs at links crossings and rounded links.
Visio2013Importer improvements
- The Item argument of ImportItem event handlers is now pre-set to a DiagramItem instance created for the imported Visio shape, letting you avoid parsing some standard data such as Bounds or Text. You can either modify this item’s properties, or replace it with a new instance of a different type.
- a few bugs have been fixed
Miscellaneous
- node rotation was ignored by link routing algorithm; now links are routed around the rotated node’s boundaries.
- the routeAllLinks function pulls apart link segments if they would overlap.
- set Diagram.Behavior to Pan to let users only pan the view when dragging the mouse.
- and more – you can read the list here.
The trial version is available for download from the link below:
Download MindFusion.Diagramming for ASP.NET MVC, V1.8
MindFusion support team is happy to assist you with any questions you might have about Diagramming for ASP.NET MVC or any other of our products. You can leave a message at the discussion board, use the help desk or e-mail support@mindfusion.eu.. We strive to provide competent and detailed answers to your questions within hours of receiving them.
About Diagramming for ASP.NET MVC Control: It is a multi-purpose diagramming tool that consists of two parts: a .NET class library running on the server and a client side control implemented in JavaScript. The server side .NET library implements a flow-diagramming object model that lets you define structures such as trees, flowcharts and graphs. Every element in the diagram is easily accessible and the whole diagram is rendered as part of an HTML page by just calling the DiagramView extension method.
On the client the diagram is rendered by a DiagramView JavaScript control that draws its content on an HTML Canvas. The user is able to add nodes and links simply by drawing them with the mouse. There is also a NodeListView control, which lets users create new nodes via drag and drop.
MvcDiagram also supports various automatic layout algorithms that will make every diagram easy to understand and nice to look at. The diagram can also be easily serialized in binary or XML format. Exporting is done in a variety of formats including Pdf, Svg, Visio and more. You can read details about the components at the MvcDiagram features page.