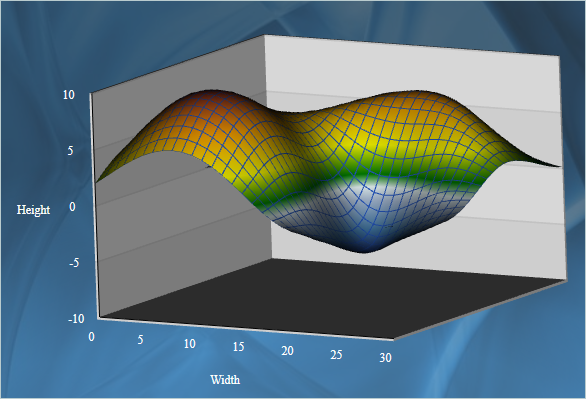
This is a step-by-step guide on how to build a surface chart using MindFusion WPF Surface Chart control. The data is set with data binding. After we build the chart we’ll adjust some properties and preview how they affect the chart appearance.
Step-by-step guide on how to build a 3D surface or scatter chart
I. General Settings
We start with a new WPF project and add the libraries needed for the WPF surface chart: MindFusion.Charting.Wpf and MindFusion.Licensing. We create a mapping to the charting namespace like that:
xmlns:chart="http://mindfusion.eu/charting/wpf"
If you have installed the control or MindFusion WPF Pack with toolbox integration you’ll just need to drag and drop the surface chart control.
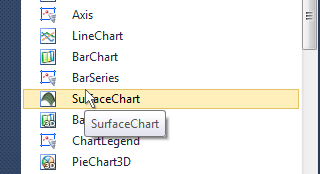
Drag and drop the surface chart control
Next step is to declare the Surface Chart. We do this in XAML:
<chart:surfacechart x:name="surfaceChart" effect3d="ShaderEffect" scatterfacesize="1" showsurface="True" showwireframe="True" showscatters="False" title="ScatterChart3D" sidewallthickness="0.5" interpolationtype="Bezier" gridtype="Horizontal" scale="200" groundlevel="0">
</chart:surfacechart>
We use a ShaderEffect to make the chart more beautiful. The ShowSurface property means the control shall draw a surface but will not draw a wireframe or scatters – we’ll change that later. The SideWallThickness sets how the walls will look – we make them modestly thick. If we don’t set a GridType it will be more difficult to read the chart, so we set a horizontal grid. Scale determines how the chart will be zoomed and GroundLevel sets the location of the bottom or ground wall.
II. Data Binding
We’ll use a single series in the chart and we initialize it in XAML as well:
<chart:surfaceseries x:name="series1">
</chart:surfaceseries>
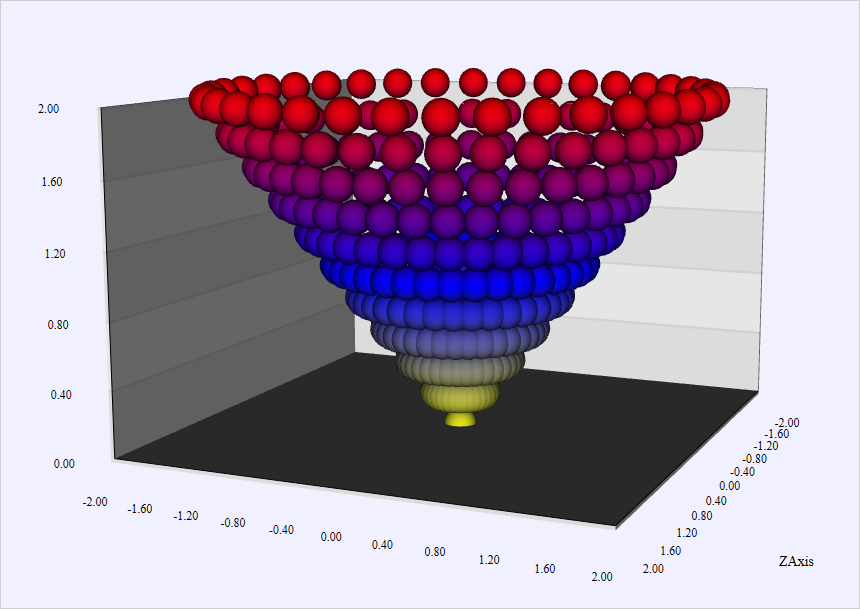
For the purpose of this sample we create just a List of Point3D objects, which will be the data source. We do this in code.
List Data = new List();
Point3D point3D;

for (int i = 0; i < 360; i+=10)
{
double angle_rad = i / 180.0 * Math.PI;

for (int r = 0; r <= 10; r++)
{
double radius = r * 0.2;
double x = radius * Math.Cos(angle_rad);
double z = radius * Math.Sin(angle_rad);

point3D = new Point3D(x, radius, z);
Data.Add(point3D);
 }
}
We generate the points using the algorithm for a cone. Now let’s bind the data list to the chart’s properties.
surfaceChart.DataSource = Data;
series1.XDataPath = "X";
series1.YDataPath = "Y";
series1.ZDataPath = "Z";
The DataPath properties specify the names of each data bound property.
Now that we know our data we must set the minimum and maximum value of all three chart axes to make sure data is rendered correctly:
surfaceChart.XAxisSettings.MinValue = -2;
surfaceChart.XAxisSettings.Interval = 0.4;
surfaceChart.XAxisSettings.MaxValue = 2;
surfaceChart.YAxisSettings.MinValue = 0;
surfaceChart.YAxisSettings.MaxValue = 2;
surfaceChart.YAxisSettings.Interval = 0.4;
surfaceChart.ZAxisSettings.MinValue = -2;
surfaceChart.ZAxisSettings.MaxValue = 2;
surfaceChart.ZAxisSettings.Interval = 0.4;
Each axis exposes MinValue, MaxValue and Interval properties, which are used to define the scale.
III. Colours
The colours for a surface chart are set with the Fills property. In a surface chart, if you use a gradient brush, each point will read its color mapped to the matching position on the gradient. If you want more details, you can use the TextureType and ColorMapList properties to specify the colour map. In our sample we use XAML and add a gradient brush:
<chart:surfaceseries.fills>
 	<lineargradientbrush startpoint="0,0" endpoint="0,1">
<gradientstop color="#D2D9A3" offset="0">
<gradientstop color="#023E73" offset="0.33">
<gradientstop color="#8A188C" offset="0.66">
<gradientstop color="#F24B6A" offset="1.0">
</gradientstop></gradientstop></gradientstop></gradientstop></lineargradientbrush>
</chart:surfaceseries.fills>
IV. Customizations
We can show a wire frame by setting ShowWireFrame to “true”. If we want to show scatters, we’d better turn off ShowSurface and set ShowScatters to true. A wire frame can be show no matter the surface type. You can combine all of them – scatters, wire frame and surface.
InterpolationType lets you choose among various types of interpolation. Choosing None means that the control shall simply connect the 3D points.
An important property is PointMergeThreshold – it indicates the smallest difference at which a point that comes too close to another point won’t be drawn. If we set it to 0 or a negative number all points will be drawn.
Here is a selection of images of charts with different combination of surface properties turned on: wire frame, surface, scatters.
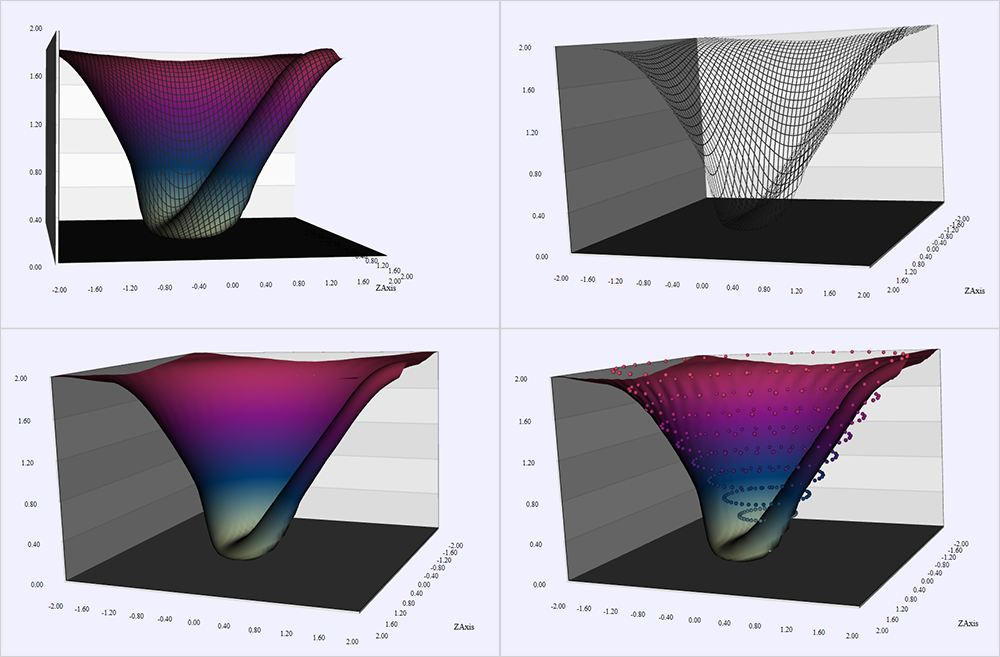
By turning a single property you can completely change the appearance of a 3D surface chart
You can download the sample directly from this link:
Download MindFusion Surface Chart Tutorial
Learn more about the WPF Chart & Gauge control here.