Pan and Zoom Programmatically in a JavaScript Diagram

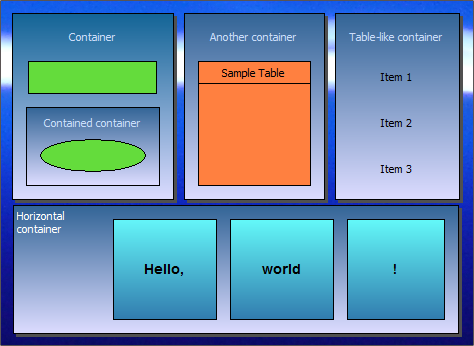
We will build a diagram with 50 random nodes and we will zoom and pan this diagram programmatically. Here is a screenshot of the final diagram, which is a link to the sample:

We will use the MindFusion Diagramming library for JavaScript.

I. Project Setup

We add a reference to the MindFusion.Diagramming.js and MindFusion.Common.js files. We also add a reference to another file called MouseEvents.js. This is our code-behind file.

<script src="MindFusion.Common.js" type="text/javascript"></script>
<script src="MindFusion.Diagramming.js" type="text/javascript"></script>
<script src="MouseEvents.js" type="text/javascript"></script>

In the BODY of the web page we create a Canvas element, to which we assign an id. This is important, because we will refer to the Canvas in code:

<div style="width: 100%; height: 100%; overflow: auto;">
    <canvas id="diagram_canvas" width="2100" height="2100">
        This page requires a browser that supports HTML 5 Canvas element.
    </canvas>
</div>

II. Diagram Settings

In the code-behind file that we called MouseEvents.js we use the DOMContentLoaded event to initialize the diagram.

document.addEventListener("DOMContentLoaded", function ()
{
    // create a Diagram component that wraps the "diagram_canvas" canvas
    diagram = MindFusion.AbstractionLayer.createControl(Diagram, null, null, null, document.getElementById("diagram_canvas"));
    diagram.setBounds(new Rect(5, 5, 2000, 1000));

We use the createControl method of the AbstractionLayer class to create an instance of the Diagram class. The setBounds method determines the size of the diagram’s drawing area. If this size is bigger than the size of the Canvas, the diagram automatically shows scrollbars. Note that only if the diagram’s area is larger than the canvas we can use panning.

We use some settings of the Diagram class to customize the application:

diagram.setDefaultShape("Rectangle");
diagram.setRouteLinks(true);
diagram.setRoundedLinks(true);
diagram.setShowGrid(false);

The links will be routed and rounded and no grid will be rendered.

III. Diagram Items

We create the diagram nodes with the createShapeNode method of the Factory class. The Factory class as an instance is available through the getFactory() method:
for(var i = 0; i < 50; i++)

    {
        var colorIndex = Math.floor(Math.random() * 3);  
        var shape = diagram.getFactory().createShapeNode(new Rect(136, 36, 20, 10));
        shape.setBrush({ type: 'SolidBrush', color: colors[colorIndex] });
        if(i % 3   == 0)
            shape.setShape('Ellipse');
        else 
            shape.setShape('Rectangle');
        if( i % 7 == 0)
        {
            shape.setBounds(new Rect(136, 36, 16, 8));	
        }
		
        shape.setText("Node " + (i + 1).toString());
        shape.setTextColor("white");
    }

We make each third shape Ellipse and we choose the brush on a random principle out of three brushes, that we initialized in an array. Each seventh shape is slightly smaller – that is set with the setBounds method, which takes as an argument a Rect, that is slightly smaller than the Rect instance that we use when we create the shape nodes.

The connectors among the nodes are created with the createDiagramLink method of Factory . We cycle through all 50 nodes and connect each one of them with a randomly taken node from the diagram nodes collection. This collection is available through the nodes proeprty of the Diagram class:

diagram.nodes.forEach(function(node)
{
    var nodeIndex = Math.floor(Math.random() * 50);  

    var node2 = diagram.nodes[nodeIndex];
    var link = diagram.getFactory().createDiagramLink(node, node2);
    link.setHeadShape("Circle");
})

We customize the appearance of the link through the setHeadShape method. We choose the ‘Circle’ shape as a head to each link.

We have created the diagram items with the same bounds, which means they are on top of each other. The best way to arrange them is with one of the automatic layout algorithms, available with the JsDiagram. They are members of the MindFusion.Graphs namespace – you can check the rest. In our sample we’ve chosen the LayeredLayout ,which provides quite nice result. We set its direction to LayoutDirection .There a few other properties that we’ve set that regulate the node distance, the layer distance and more:

var layout = new MindFusion.Graphs.LayeredLayout();
layout.direction = MindFusion.Graphs.LayoutDirection.LeftToRight;
layout.siftingRounds = 0;
layout.nodeDistance = 8;
layout.layerDistance = 8;
diagram.arrange(layout);

All layouts are applies through the arrange method of the Diagram that takes an instance of the layout as an argument.

IV. Pan and Zoom

We will implement pan and zoom by handling standard DOM events. The first one is the “wheel” event, which we attach to the diagram canvas element:

var dgrm = document.getElementById('diagram_canvas');

dgrm.addEventListener('wheel', function(e)
{
    var zoom = diagram.getZoomFactor();
    zoom -= e.deltaY / 10;
    if (zoom > 10)
        diagram.setZoomFactor(zoom);

    e.preventDefault(); // do not scroll
});

We use the getZoomFactor and setZoomFactor methods of the Diagram , to manipulate the zoom ratio. The zoom step is calculated based on the deltaY value of the event args. You can command the amount of zoom by dividing by a smaller or a larger number. It is important that we call preventDefault() on the event arguments, to surpass the default response of the canvas to the wheel event.

The panning is implemented by handling the mousedown and mouseup DOM events of the Canvas.

/* events fired on the draggable target */
dgrm.addEventListener('mousedown', function(e)
{
 if( e.ctrlKey)
	diagram.setBehavior(MindFusion.Diagramming.Behavior.Pan);
 
}, false);

dgrm.addEventListener('mouseup', function(e)
{
 if( e.ctrlKey)
	diagram.setBehavior(MindFusion.Diagramming.Behavior.LinkShapes);
 
}, false);

If we want to make the Diagram pan we need simply to change the diagram’s behavior with the setBehavior method. The options are members of the Behavior enumeration. When the user clicks on the Diagram and the Ctrl key is pressed, we change the diagram’s behavior to “Pan”. When the mouse is up, but the Ctrl key is pressed, we rest the behavior back to LinkShapes. This is the default behavior, where dragging with the mouse creates new shapes, while dragging between existing DiagramShape -s, creates DiagramLink -s.

With that our sample is ready. You can download the source code from this link:

Download the Mouse Events Sample with JavaScript Diagram

Technical support is available through MindFusion forum here.

About Diagramming for JavaScript: This native JavaScript library provides developers with the ability to create and customize any type of diagram, decision tree, flowchart, class hierarchy, graph, genealogy tree, BPMN diagrams and much more. The control offers rich event set, numerous customization options, animations, graph operations, styling and themes. You have more than 100 predefined nodes, table nodes and more than 15 automatic layout algorithms. Learn more about Diagramming for JavaScript at https://mindfusion.eu/javascript-diagram.html.

Charting for WPF, V2.0

The list below describes recent changes and additions to MindFusion.Charting for WPF:

Support for Multiple Axes

The chart can now render multiple axes at each side of the plot area. To enable that, add a new Axis instance to the XAxes collection properties for bottom axes, to YAxes collection for left-hand axes, and X2Axes / Y2Axes for respectively top and right sides. The old AxisSettings class and XAxisSettings / YAxisSettings objects have been removed, and now their properties are set independently for each Axis instance in the collections.

Multiple axes in the WPF chart control.

Multiple axes in the WPF chart control.

Improved Zooming

Selected area with width smaller than MinZoomSpan does not evoke any action in the control. In addition, the new ZoomChanged event fires whenever zoom occurs and provides useful data for the zoom action with its ZoomChangedArgs.

Cross Hair Improvements

The cross hair control has been improved with several new properties, a method and an event. The properties are:

The new CrossHairPosition method returns the current location of the cross hair. For more precise handling of cross hair movements a new event is available – CrossHairPositionChanged.

Cross hair is drawn in a WPF column chart.

Cross hair is drawn in a WPF column chart.

Greatly Improved 3D Charts

3D charts have received plenty of improvements, new properties and performance optimizations: PointMergeThreshold – The property sets the radius of an area around a given point where no other points are drawn. The result is better performance especially in charts with numerous points, which happen to be close to one another. Of points with similar coordinates only a single one is rendered, the rest are omitted.

InterpolationType.None – A new InterpolationType has been added to the InterpolationType enum, which does not interpolate but adds data directly and connects the points with triangulation.

The SurfaceType enum has been replaced with three bool properties, which makes the API easier to understand and use.

ScatterFaceSize – the property regulates the size of the polygons that build a 3D scatter. Bigger values lead to bigger polygons, which results in faster performance and rougher scatter mesh. Effect3D.ShaderEffect – the property can be applied to all 3D chart elements, including scatters and performs much faster.

3D surface chart with color map and wire frame.

3D surface chart with color map and wire frame.

Exporting Images

Two new methods have been added for exporting the chart as an image – CreateImage and ExportImage.

Custom Formatting of Labels in Real-time Charts

A new property has been added to the RealTimeChart library – Axis.LabelFormatProvider. Use it to specify custom formatting of numeric labels. If required, you can specify format arguments for your format classes with Axis.LabelFormat.

Direct download of the trial version is available from here:

Download MindFusion.Charting for WPF 2.0 Trial Version

You are welcome to contact us with any questions, problems or inquiries about the Charting for Wpf control or any other of our products. MindFusion has always put special emphasis on providing excellent customer support and we usually answer your inquiries in a few hours of receiving them.

About MindFusion.Charting for Wpf: A programming component that combines powerful charting capabilities with an elegant API and easy use. Among the features of the control are fully customizable grid, positive and negative values on all chart axes, 3D charts, gauges and many more – read a detailed list here.

The control provides detailed documentation and various samples that demonstrate how to customize every type of chart. It supports a wide range of 2D and 3D charts including bar, line, radar, bubble pie etc. You can add tooltips, define themes, perform hit testing, zoom and more.

Diagramming for ASP.NET, V5.4.2

The new version 5.4.2 of Diagramming for ASP.NET offers web developers a setoff useful new features. Here are the details:

Canvas mode improvements

  • Shape property of TableNode and ContainerNode is now supported in Canvas mode.
  • CellFrameStyle and EnableStyledText properties of TableNode are now supported in Canvas mode.
  • CellTextEditedScript event raised when users edit the text of table cells.
  • CreateEditControlScript event lets you create custom DOM element or fragment to use as in-place text editor.
  • NodeListView raises nodeSelected event when the user selects a node.
  • Load XML files from client side by calling loadFromXml method of Diagram class.
  • Fixed setZoomFactorPivot bug in virtual scroll mode.
MindFusion ASP.NET Diagram Control: Table Nodes

MindFusion ASP.NET Diagram Control: Table Nodes

Miscellaneous

  • NodeTextEdited, LinkTextEdited and CellTextEdited server-side events.
  • createThickness method added to ScriptHelper.
  • Sample projects have been improved and extended.
MindFusion ASP.NET Diagram Control: Container Nodes

MindFusion ASP.NET Diagram Control: Container Nodes

Here is a direct link to download the trial version:

Download MindFusion.Diagramming for ASP.NET, V5.4.2 Trial Version

Technical support
MindFusion support team is happy to assist you with any questions you might have about Diagramming for ASP.NET or any other of our products. You can leave a message at the discussion board, use the help desk or e-mail support@mindfusion.eu.. We strive to provide competent and detailed answers to your questions within hours of receiving them.

About Diagramming for ASP.NET: An advanced WebForms programming component that offers all the functionality that is needed for creating, styling and presenting attractive flowcharts, hierarchies, trees, graphs, schemes, diagrams and many more. The control offers numerous utility methods, path finding and cycle detection, rich event set and many useful user interaction features like tool tips, multiple selection, copy/paste to/from Windows clipboard and many more.

NetDiagram offers more than 100 predefined node shapes, scrollable tables, 13 automatic layouts and many
more. You can check the online demo to see some of the features in action. The control includes many samples, detailed documentation and step-by-step tutorials. Every features is duly documented and there’s plenty of code to copy. The component is not only powerful and scalable, but easy to learn and fun to use.

Diagramming for Silverlight, V3.0.1

We have released a new version of the Diagramming component for Silverlight. Here is an overview of the new features:

Zoom control

The new ZoomControl class lets users interactively change the zoom level and position of a diagram. In order to use the ZoomControl, place it anywhere over the target diagram and set the target property of the control to that diagram. Use the ZoomStep and ScrollStep properties to customize the control. The control’s appearance is customized with the Fill, Stroke, CornerRadius and TickPosition properties.

The zoom control and the new predefined node shapes.

The zoom control and the new predefined node shapes.

Miscellaneous

  • Use the new AllowRenamePages property of TabbedDiagramView to let users rename a DiagramPage interactively by clicking on its tab.
  • Several new stock shapes have been added: RightTriangle, Decagon, Trapezoid, Star4Pointed, Star5Pointed, Star6Pointed, Star7Pointed, Star16Pointed, Star24Pointed, Star32Pointed, Donut, Plaque.
  • The HandlesStyle property of nodes supports two new handle styles – RoundAndSquare and RoundAndSquare2.
  • The SetSelfLoopShape event is raised when a link becomes a self-loop. You can set a custom shape for that link.
  • and much more – find the full list here.
Tabbed view.

Tabbed view.

Direct download of the trial version is available from the link below:

Download DiagramLite 3.0.1 Trial Version

Feel free to contact us with any questions about Diagramming for Silverlight or any other of our products – please use the forum, email support@mindfusion.eu or the help desk. We strive to provide competent and detailed answers to all support inquiries within hours of receiving them.

About MindFusion.Diagramming for Silverlight: A programming component specially designed and developed to provide web developers with a fast and easy way to create diagrams, graphs, schemes, hierarchies, charts and many more. The impressive feature set of the control ranges from predefined node shapes to custom nodes and thirteen automatic layouts. The style and appearance of all diagram elements are completely customizable, the numerous samples provide programmers with plenty of example code to look from.

The control boasts intuitive API that is documented in details in the help file provided with the installation. There are also step-by-step tutorials and various guides. You can check the features list here to find out more about the capabilities of the tool. An online demo is also available. The prices are per developer, source code is also available. Learn more about the licensing scheme here.

Diagramming for WPF, V.3.0.4 and Diagramming for WinForms, V.6.1.1

MindFusion has released new versions of two of its diagramming components – Diagramming for WPF and Diagramming for WinForms. The new features in both controls are identical – here is an overview of them:

Import of Visio 2013 files

The new Visio2013Importer class imports .vsdx files, created by Microsoft Visio 2013. The class is part of the MindFusion.Diagramming.Wpf.VisioImport.dll assembly (for WpfDiagram) and the MindFusion.Diagramming.Import.Visio.dll assembly (for FlowChart.NET) – make sure you reference the correct assembly according to your platform. The Import method has different overloads that let you import the Visio file into a single Diagram, whose content is merged from all Visio pages or into a DiagramDocument, whose pages correspond to the Visio drawing pages.

The importer creates a MindFusion.ShapeNode object for each shape from the .vsdx file and sets its Shape, Text, Brush and Pen properties to match the original shape as closely as possible. Each Visio connector shape is represented by a DiagramLink object, whose Origin, Destination and ControlPoints properties preserve the location and appearance of the original shape.

The Zoom control and the new Visio 2013 shape nodes

The Zoom control and the new Visio 2013 shape nodes

Zoom control

The new ZoomControl class lets you change interactively the zoom level and scroll position of any Diagram or DiagramView object. Its usage is very simple – just drag the ZoomControl and place it anywhere over the target diagram, then set the control’s Target property to that diagram or view. The ZoomStep and ScrollStep properties let you customize the amount added to the control’s zoom level or scroll position when the user clicks the control buttons. The appearance of the control is customized with the Fill, Stroke, CornerRadius and TickPosition properties.

New features added to the MindFusion.Diagramming for WPF component:

  • Users can rename a DiagramPage interactively by clicking its tab. This is done with the new AllowRenamePages property of TabbedDiagramView.
  • New shapes have been added for better Visio 2013 compatibility: RightTriangle, Decagon, Trapezoid, Star4Pointed, Star5Pointed, Star6Pointed, Star7Pointed, Star16Pointed, Star24Pointed, Star32Pointed, Donut, Plaque.
  • The PdfExporter now supports DefaultEncoding and AutoDetectEncoding properties.
  • More new features – check the full list here: http://mindfusion.eu/Forum/YaBB.pl?num=1389798301
Tabbed view in the WinForms component

Tabbed view in the WinForms component

New features added to the MindFusion.Diagramming for WinForms component:

  • You can change the active page in the TabbedDiagramView control with the arrow buttons
  • You can rename interactively the title of a DiagramPage by clicking the active tab in the TabbedDiagramView control.
  • New shapes have been added for better Visio 2013 compatibility: RightTriangle, Decagon, Trapezoid, Star4Pointed, Star5Pointed, Star6Pointed, Star7Pointed, Star16Pointed, Star24Pointed, Star32Pointed, Donut, Plaque.

The trial versions of the components are available for download from these links:

Download Diagramming for WinForms, Version 6.1.1

Download Diagramming for WPF, Version 3.0.4

If you require technical support, please contact MindFusion support team per e-mail or phone. You can also use the forum or help desk. All support inquiries are answered within hours of receiving them.

About MindFusion.Diagramming for Wpf: Designed and developed to be easy to integrate, use, and customize, this native WPF component places at your disposal every single feature you would ever need to create flowcharts, diagrams, graphs, schemes, DB relationships, trees and many more. Its long list of style options gives you complete control over the appearance of the diagram. With a set of eight automatic layouts you are sure to choose the best arrangement for your items and make the diagram easy to comprehend.

The control boasts a long list of events, properties and methods for user interaction, item creation, data input and output. You can read the full features list here. The online demo shows samples that demonstrate various capabilities of the control. The licensing scheme and prices are uploaded at the buy page. Source code is also available.

About MindFusion.Diagramming for WinForms: A programming component that provides any WinForms application with a full set of features for creating and customizing all types of diagrams, flowcharts, schemes, hierarchies, trees, graphs etc. The control provides numerous ways to save and load a diagram, six auxiliary controls and more than 10 automatic graph layout algorithms. Diagram elements include scrollable tables, container nodes, multi-segment arrows, custom diagram item types and many more. Further details here.

Diagramming for WinForms is a royalty-free component, clients get 12 month upgrade subscription when buying a license. The source code is also available for purchase. Visit the buy page for a list with the current license prices.