We are going to use the JS flowchart library as a database design tool. We will create DB tables, add rows, connect the tables and generate SQL statements that would create the tables.
Here is a screenshot of the application:
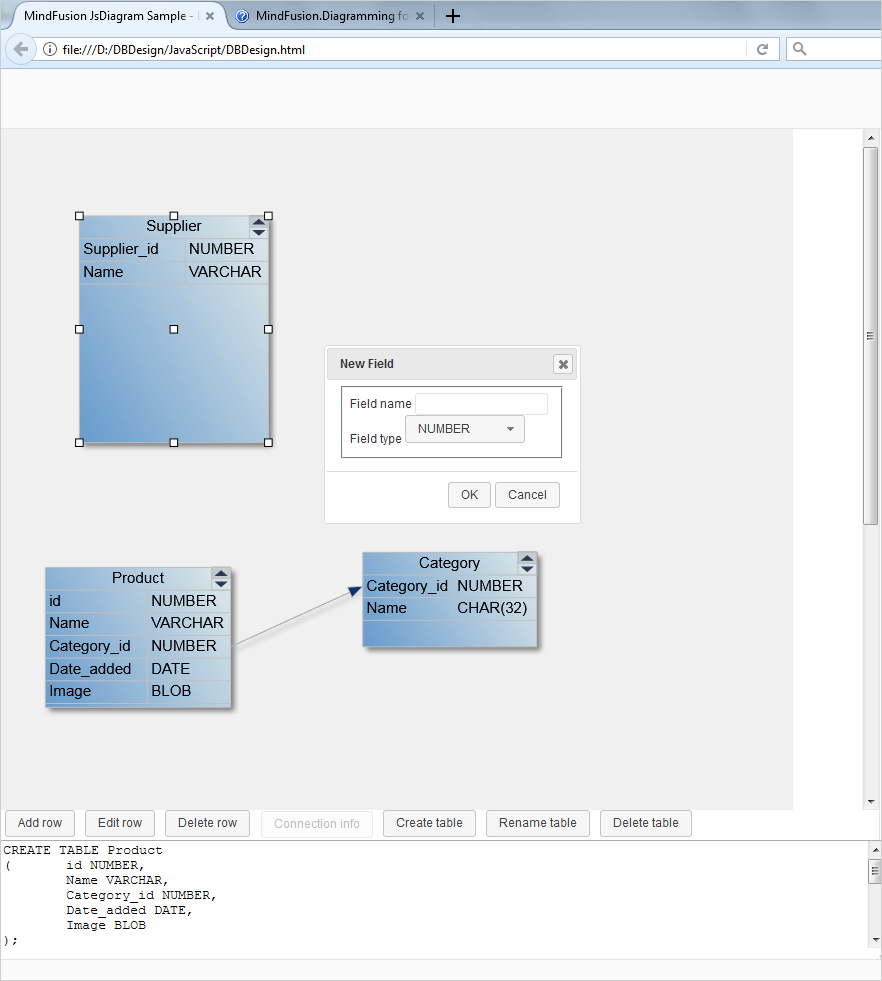
Database Designer Application with SQL Generator
I. Project Setup
We need two JavaScript libraries for the flowchart:
- MindFusion.Common.js
- MindFusion.Diagramming.js
We copy them in the work folder of the project, where we will put the HTML and the JavaScript code behind. Then we create an HTML file and name it DBDesign.html. There we will reference the two JavaScript libraries:
<a href="http://MindFusion.Common.js">http://MindFusion.Common.js</a>
<a href="http://MindFusion.Diagramming.js">http://MindFusion.Diagramming.js</a>
We reference those two libraries at the end of the HTML file, just before the closing tag. This way we are sure that the majority of the browsers will load the scripts correct.
We need an HTML 5 Canvas element for the diagram to draw itself onto and we create one inside a <div> tag:
<div style=”position: absolute; width: 100%; height: 100%; overflow: auto;”>
<canvas id=”diagram” width=”2100″ height=”2100″>
This page requires a browser that supports HTML 5 Canvas element.
</canvas>
</div>
It’s important to set and id for the Canvas element, that’s how we will get it in the JavaScript code behind file.
We create the JS file to be used by this project as DBDesign.js and we place it in the same directory as the two other JS files. We add a reference to it in the HTML page:
<a href="http://DBDesign.js">http://DBDesign.js</a>
II. UI Controls
The DBDesigner has a line of controls at the bottoms that provide menus – add/edit/delete row, create/delete/rename table and a button for connection info. We create them as buttons:
<div id="controls" style="height: 150px" left:="" 0;="" right:="" 401px;"="">
   <input type="button" id="btnAddRow" value="Add row" style="margin-left: 5px; margin-bottom: 2px;">
   <input type="button" id="btnEditRow" value="Edit row" style="margin-left: 5px; margin-bottom: 2px;">
   <input type="button" id="btnDeleteRow" value="Delete row" style="margin-left: 5px; margin-bottom: 2px;">
…..
</div>
We add a textarea for the generated SQL and we close the div:
<textarea id="generatedSql" style="height: 120px;width: 100%"></textarea>
When the user presses one of those buttons we show a dialog. The dialogs are forms. Here is the form that renames a table:
<div id="renameTable-dialog" title="Rename Table">
  <form>

<fieldset>
  	 <label for="renameTableCaption">Table name</label>
</fieldset>

	</form>
</div>
III. General Diagram Settings
Let’s start coding the JavaScript methods for the DBDesign application. We use the document.ready method to initialize the Diagram:
var Diagram = MindFusion.Diagramming.Diagram;

var diagram;

$(document).ready(function () {
   // create a Diagram component that wraps the "diagram" canvas
   diagram = MindFusion.AbstractionLayer.createControl(Diagram, null, null, null, $("#diagram")[0]);
……….

});
We use the id of the diagram Canvas that we set in the web page and now create the diagram control. Once we have it we set some properties to it:
// set some Diagram properties.
diagram.setBehavior(Behavior.LinkTables);
diagram.setAllowSelfLoops(false);
diagram.setBackBrush('#F0F0F0');
diagram.setLinkHeadShape('Triangle');
diagram.setLinkHeadShapeSize(4);
diagram.getSelection().allowMultipleSelection = false;
We change the default Behavior of the diagram control to “LinkTables”, which means users would be able to connect table rows. We stop users from creating self loops on tables and add some styling: the back brush is set to light gray, the head shape of links is ‘Triangle’ and we forbid the users to select multiple objects.
The styling of the diagram is done through themes. We create a theme and add to it a style for the table nodes:
// set the Diagram style.
var theme = new Theme();

var tableNodeStyle = new Style();
tableNodeStyle.setBrush({ type: 'LinearGradientBrush', color1: 'rgb(224, 233, 233)', color2: 'rgb(102, 154, 204)', angle: 30 });
tableNodeStyle.setTextColor({ type: 'SolidBrush', color: 'rgb(45, 57, 86)' });
tableNodeStyle.setStroke('rgb(192, 192, 192)');
The tableNodeStyle sets the brush, text color and stroke for the tables. Let’s tell the theme object that this is the style for table nodes:
theme.styles['std:TableNode'] = tableNodeStyle;
And let’s tell the diagram control that it has a theme:
diagram.setTheme(theme);
Link styling is done in the same way and you can find the code in the *.zip file that is available for download.
IV. Events
Handling events is the most important part of this application. We have events raised by the diagram elements and we have events that are raised by the JavaScript buttons. Let’s start with the js buttons. When the web page is loaded there is a single button active from the row of buttons available at the bottom of the page – “Create table”. In the document.ready() method we wire the button with an event:
$('#btnCreateTable').button().click(function (event) { createTable(); });
This event calls the createTable method that generates a TableNode instance:
function createTable() {
	// create a new table with the specified extent
	var table = diagram.getFactory().createTableNode(
				15 + tableCount * 3, 15 + tableCount * 4, 50, 60);
	table.setText("Table" + tableCount++);
	table.redimTable(2, 0);
	table.setScrollable(true);
	table.setConnectionStyle(ConnectionStyle.Rows);

	// set the first column to resize with the table
	table.getColumn(0).columnStyle = ColumnStyle.AutoWidth;

	generateSQL();
}
The createTableNode method accepts as arguments the x and y coordinates of the new TableNode and its width and height. We create initially the table with two columns and no rows. By default the tables can be scrolled and the links connect table rows.
The generateSQL method is a simple one – it just creates an SQL table. You can expand the sample with more complicated SQL statements but in our case we just create a table with the columns that were set to the TableNode:
function generateSQL() {
   var text = '';

   // enumerate all tables in the current diagram
   ArrayList.forEach(diagram.nodes, function (table) {
   text += "CREATE TABLE " + table.getText() + "\r\n(";

   // enumerate all rows of a table
   for (var r = 0; r < table.cells.rows; ++r) {
   // get text of cells in current row
   text += "\t" + table.getCell(0, r).getText() + " " + table.getCell(1, r).getText();
   if (r < table.cells.rows - 1)
	 text += ",\r\n";
   }
	text += "\r\n);\r\n\r\n";
   });

  $('#generatedSql')[0].innerHTML = text;
}
When the SQL text is generated we assign it to the textarea instance that we created.
V. Diagram Events
Here we will talk about the events fired by the diagram control. Once a table is created the users can double click on it to create new rows, edit or delete existing rows. This happens when we handle the nodeDoubleClicked event:
diagram.addEventListener(Events.nodeDoubleClicked, function (sender, args) {
	if (tblClicked != args.getNode()) {
		tblClicked = args.getNode();
	}
….

});
Here we identify the table that is clicked and then we have to decide which dialogue to show:
if (tblClicked) {
		var cellClicked = tblClicked.cellFromPoint(args.getMousePosition());
		if (cellClicked) {
			rowClicked = cellClicked.row;
			editRowOpen();
		}
		else if (tblClicked.hitTestManipulators(args.getMousePosition()) == null) {
		if (args.getMousePosition().y <= tblClicked.getBounds().y + tblClicked.getCaptionHeight())
			renameTableOpen();
			else
			addRowOpen();
		    }
		}
If an existing cell is clicked we open the editRow form. If the caption of the table was clicked we open the form for rename of a table. If none of those, we open the form that adds a new row.
Let’s look how the addRow dialogue opens:
function addRowOpen() {
  var table = tblClicked || diagram.getActiveItem();

  if (!table || !AbstractionLayer.isInstanceOfType(TableNode, table))
	return;

   addRowDialog.dialog("open");
}
the method calls the dialog method of addRowDialog. At the beginning of the js file we have declared a variable:
var addRowDialog = null
Then we create the addRowDialog object:
addRowDialog = $("#addRow-dialog").dialog({
		autoOpen: false,
		resizable: false,
		height: 'auto',
		width: 250,
		modal: false,
		buttons: {
			"OK": addRow,
			Cancel: function () {
				addRowDialog.dialog("close");
			}
		},
		close: function () {
			addRowType.val("NUMBER");
			addRowType.selectmenu("refresh");
			addRowForm[0].reset();
		}
	});
	addRowForm = addRowDialog.find("form").on("submit", function (event) {
		event.preventDefault();
		addRow();
	});
Here we create the dialog that has auto height, width of 250 and two buttons: OK and Cancel. The Cancel button closes the dialog. When the user has pressed OK the form is submitted and the addRow method is called.
The form that shows is defined in the HTML page and looks like that:
div id="addRow-dialog" title="New Field">
		<form>

<fieldset>
			<label for="addRow-fieldName">
				Field name</label>

			<label for="addRow-fieldType">
				Field type</label>

				NUMBER
				CHAR(32)
				DATE
				VARCHAR
				BLOB

</fieldset>

		</form>
</div>
The addRow method gets the clicked table and gets the two cells at the last row. It gets the text that was chosen in the dialog and assigns it to the cells. Then the dialog is closed and the SQL is generated once again.
function addRow() {
	var table = tblClicked || diagram.getActiveItem();

	if (!table || !AbstractionLayer.isInstanceOfType(TableNode, table))
		return;

	table.addRow();

	var lastRow = table.cells.rows - 1;

	// use the cell indexer to access cells by their column and row
	table.getCell(0, lastRow).setText(addRowName[0].value);
	table.getCell(1, lastRow).setText(addRowType[0].value);

	// close the dialog
	addRowDialog.dialog("close");

	// refresh SQL definition
	generateSQL();
}
And that’s the end for this tutorial. You can download the sample together with the necessary JavaScript libraries from this link:
Download the JavaScript Database Designer Application
Find out more about MindFusion JavaScript Diagram Library at https://mindfusion.eu/javascript-diagram.html