
Most tree structures are built as hierarchies: the number of nodes increases at each level. In our sample we will look at a tree, where not all branches have a higher number of nodes than their predecessors. In our tree some nodes will have multiple parents e.g. there are nodes that have several ancestors.
You can try the sample online:

In order to build this application we use MindFusion Diagramming for JavaScript library.
I. General Settings
In a web page we add the code that initializes a Canvas. We give the Canvas an id:
<div style="overflow: visible; height: 100%; margin: 1px; padding: 0px;">
    <canvas id="diagram" width="2100" height="2500">
        This page requires a browser that supports HTML 5 Canvas element.
    </canvas>
</div>
We add references to the two JavaScipt files that provide the diagramming functionality: MindFusion.Diagramming and MindFusion.Common. We also add a reference to a code-behind file that contains the JavaScript code for our application:
<script src="Scripts/MindFusion.Common.js" type="text/javascript"></script>
<script src="Scripts/MindFusion.Diagramming.js" type="text/javascript"></script>
<script src="MultipleParentNodes.js" type="text/javascript"></script>
We have placed those files in a subfolder called Scripts, which is located in our main application folder.
II. Diagram Settings
We create the diagram in the window.onload event handler. We want to be sure that all scripts are loaded:
window.onload = function(e)
{
    var diagramEl = document.getElementById('diagram');
    // create a Diagram component that wraps the "diagram" canvas
    diagram = AbstractionLayer.createControl(Diagram, null, null, null, diagramEl);
    diagram.setAllowInplaceEdit(true);
    diagram.setRouteLinks(true);
    diagram.setShowGrid(true);
    diagram.setRoundedLinks(true);
    diagram.setBounds(new Rect(0, 0, 2000,2500));
}
We create the Diagram using a reference to the DOM element of the Canvas from the web page. We set its allowInplaceEdit property to true, which lets users edit interactively nodes and links. We use showGrid to render a background grid that helps to align nodes and links. We setRoundedLinks and give the diagram a big work are with the setBounds method.
II. Creating the Diagram Nodes
We create the DiagramNode -s in a separate method, which we call after the control is created and all settings are made:
function onLoaded()
{
    var nodes = {};

    for(var i = 0; i < 5; i++)
    {
        nodes[i] = diagram.getFactory().createShapeNode(new Rect(20, 20, 20, 12));
        nodes[i].setShape('Rectangle');
        nodes[i].setBrush({ type: 'SolidBrush', color: '#567939' });
    };
We initialize a list, where we will store dynamically those nodes that we want to have reference to. At first we create 5 ShapeNode -s that are the first level of the tree. We use the createShapeNode method of Factory to create the ShapeNode -s and DiagramLink -s. Note that we will create all nodes with equal bounds. We don’t have to worry about their location because we will apply an automatic layout at the end.
Factory is available through the getFactory method of Diagram You do not usually create the class but get an instance of it through the Diagram instance.
We use setShape to provide the id af the diagram shape that we want the node to take. A list with the diagram shapes available, together with their id-s can be found in the online help.
We also use setBrush to specify the fill of the ShapeNode . In our case we use a SolidBrush ,but there are other options to choose from.
We create then a single ShapeNode that will be the next level:
var node5 = diagram.getFactory().createShapeNode(new Rect(20, 20, 20, 12 ));
node5.setShape('Rectangle');
node5.setBrush({ type: 'SolidBrush', color: '#6f9c49' });
We color it in a slightly lighter shade of green than the nodes at the first level. We then use the Factory class once again to create the DiagramLink -s between the 5 nodes at the first level and this one single node at the second level:
    for(var i = 0; i < 5; i++)
    {
        var link = diagram.getFactory().createDiagramLink(nodes[i], node5);
        link.setHeadShape("Triangle");
        link.setText("20%");
        link.setHeadShapeSize(3.0);
        link.setHeadBrush({ type: 'SolidBrush', color: '#7F7F7F' });
    };
The setText and setHeadShape methods of the DiagramLink class allow us to specify the label of the link and its shape at the end. There is also setBaseShape that allows us the specify the shape at the start of the DiagramLink.
The lovely thing about the Factory class is that it adds automatically the newly created DiagramItem -s, such as nodes and links, to the items collection of the diagram. You can find the newly created DiagramNode -s and DiagramLink -s also as members of the nodes and links collections respectively.
Now we have 5 links coming from all 5 nodes from the first level that point to the second level:
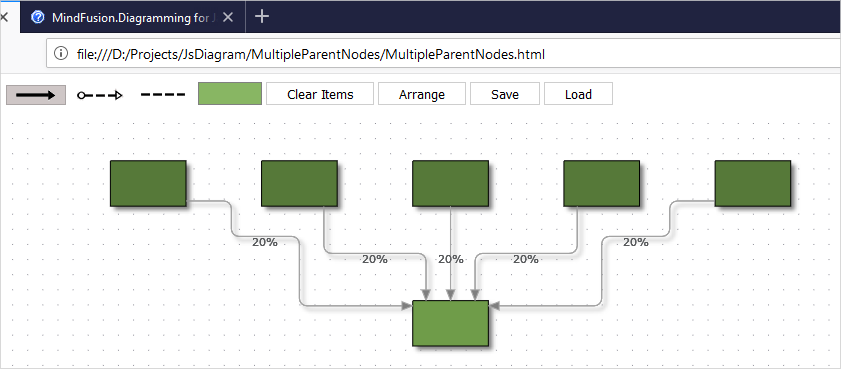
We go on doing the rest of the diagram in the same way. We create ShapeNode -s with Factory and then bind the nodes with Factory .
III. Layout
We use the LayeredLayout to arrange all nodes of the diagram. Since the diagram is not a typical tree, we prefer the LayeredLayout to the TreeLayout
var lLayout = new MindFusion.Graphs.LayeredLayout();
diagram.arrange(lLayout);
It is really easy to apply any other algorithm on the diagram – you just need to create an instance of it and call the arrange method of your diagram to apply this instance. You can quickly change layouts and experiment to see which one provides the best result.
In our case the LayeredLayout looks fine and with this we are done building the tree.
You can download the sample together with all libraries used from the following link:
A JavaScript Graph with Nodes that Have Multiple Parents
Technical support is available through MindFusion forum here.
About Diagramming for JavaScript: This native JavaScript library provides developers with the ability to create and customize any type of diagram, decision tree, flowchart, class hierarchy, graph, genealogy tree, BPMN diagrams and much more. The control offers rich event set, numerous customization options, animations, graph operations, styling and themes. You have more than 100 predefined nodes, table nodes and more than 15 automatic layout algorithms. Learn more about Diagramming for JavaScript at https://mindfusion.eu/javascript-diagram.html.