Merry Christmas and Happy New Year!
Best wishes for a very special Christmas and a Happy New Year filled with health, happiness and success!
In this post we’ll show how to use the ASP.NET MVC diagram library and SignalR to implement collaborative drawing of diagrams. This can be useful in visual planning tools where users work together on a task, such as project management or mind-mapping applications.
The complete sample project is available here –
CollabMindMap.zip
Start by creating an ASP.NET MVC application in Visual Studio. Open Tools -> Library Package Manager -> Package Manager Console and install the MindFusion.Diagramming.Mvc package –
Install-Package MindFusion.Diagramming.Mvc
While we are there, also install the SignalR package –
install-package Microsoft.AspNet.SignalR
From the project’s context menu, Add submenu, select OWIN startup class and add SignalR to the OWIN pipeline by calling –
app.MapSignalR();
Now lets add a diagram view to the home page at Views/Home/Index.cshtml, load the necessary script files and wire up diagram event handlers that will send change notifications to the hub –
@using MindFusion.Diagramming @using MindFusion.Diagramming.Mvc @{ var diagView = new DiagramView("diagramView") .NodeCreatedScript("onNodeCreated") .NodeModifiedScript("onNodeModified") .NodeTextEditedScript("onNodeTextEdited") .LinkCreatedScript("onLinkCreated") .LinkModifiedScript("onLinkModified") .LinkTextEditedScript("onLinkTextEdited") .ControlLoadedScript("onDiagramLoaded") .SetAllowInplaceEdit(true); diagView.Diagram.DefaultShape = Shapes.Ellipse; } @Html.DiagramView(diagView, new { style = "width:700px; height:600px;" }) @section scripts { @Scripts.Render("~/Scripts/jquery.signalR-2.0.0.js") @Scripts.Render("~/Scripts/MindMap.js") @Scripts.Render("~/signalr/hubs") }
The hub will synchronize operations done on the diagram by one client by sending a notification to all other connected clients. From the project context menu add a SignalR hub class, naming it DiagramHub. The model class we’ll use to describe node changes looks like this –
public class NodeModel { [JsonProperty("x")] public double X { get; set; } [JsonProperty("y")] public double Y { get; set; } [JsonProperty("width")] public double Width { get; set; } [JsonProperty("height")] public double Height { get; set; } [JsonProperty("id")] public string Id { get; set; } [JsonProperty("text")] public string Text { get; set; } }
Add these three methods to the hub class to synchronize node creation, move, resize and edit-text operations –
public void NodeCreated(NodeModel clientModel) { Clients.AllExcept(Context.ConnectionId).nodeCreated(clientModel); } public void NodeModified(NodeModel clientModel) { Clients.AllExcept(Context.ConnectionId).nodeModified(clientModel); } public void NodeTextEdited(NodeModel clientModel) { Clients.AllExcept(Context.ConnectionId).nodeTextEdited(clientModel); }
The diagram event handlers in MindMap.js fill in the model objects and call respective hub methods –
function onNodeCreated(s, e) { var hubId = $.connection.hub.id; e.node.id = hubId + s.getItems().length; var r = e.node.bounds; var model = { id: e.node.id, x: r.x, y: r.y, width: r.width, height: r.height }; diagramHub.server.nodeCreated(model); } function onNodeModified(s, e) { var r = e.node.bounds; var model = { id: e.node.id, x: r.x, y: r.y, width: r.width, height: r.height }; diagramHub.server.nodeModified(model); } function onNodeTextEdited(s, e) { var model = { id: e.node.id, text: e.getNewText() }; diagramHub.server.nodeTextEdited(model); }
Handle notifications sent from server to clients by updating the diagram from received model objects –
$(function () { diagramHub = $.connection.diagramHub; diagramHub.client.nodeCreated = function (model) { var node = diagram.factory.createShapeNode( model.x, model.y, model.width, model.height); node.id = model.id; }; diagramHub.client.nodeModified = function (model) { var node = findNode(model.id); node.setBounds( new MindFusion.Drawing.Rect( model.x, model.y, model.width, model.height), true); }; diagramHub.client.nodeTextEdited = function (model) { var node = findNode(model.id); node.setText(model.text); }; $.connection.hub.start(); });
Finally add these helper functions for finding items and storing a global diagram reference –
function onDiagramLoaded(s, e) { diagram = s; } function findNode(id) { for (var i = 0; i < diagram.nodes.length; i++) { var node = diagram.nodes[i]; if (id == node.id) return node; } return null; } function findLink(id) { for (var i = 0; i < diagram.links.length; i++) { var link = diagram.links[i]; if (id == link.id) return link; } return null; }
Start several copies of the application in separate browser instances on your system (or even on different machines if you publish it on IIS or Azure). Now start drawing nodes, moving them or editing their text – changes done on the diagram in one browser will be immediately reflected in all other browsers connected to the hub. However we aren’t yet synchronizing link operations; lets fix that –
public class LinkModel { [JsonProperty("id")] public string Id { get; set; } [JsonProperty("originId")] public string OriginId { get; set; } [JsonProperty("destinationId")] public string DestinationId { get; set; } [JsonProperty("text")] public string Text { get; set; } }
Add following hub methods in server class –
public void LinkCreated(LinkModel clientModel) { Clients.AllExcept(Context.ConnectionId).linkCreated(clientModel); } public void LinkModified(LinkModel clientModel) { Clients.AllExcept(Context.ConnectionId).linkModified(clientModel); } public void LinkTextEdited(LinkModel clientModel) { Clients.AllExcept(Context.ConnectionId).linkTextEdited(clientModel); }
Call them from respective JavaScript handlers of diagram link events –
function onLinkCreated(s, e) { var hubId = $.connection.hub.id; e.link.id = hubId + s.getItems().length; var model = { id: e.link.id, originId: e.link.getOrigin().id, destinationId: e.link.getDestination().id, }; diagramHub.server.linkCreated(model); } function onLinkModified(s, e) { var hubId = $.connection.hub.id; var model = { id: e.link.id, originId: e.link.getOrigin().id, destinationId: e.link.getDestination().id, }; diagramHub.server.linkModified(model); } function onLinkTextEdited(s, e) { var model = { id: e.link.id, text: e.getNewText() }; diagramHub.server.linkTextEdited(model); }
Handle link-related client notifications by creating or modifying links –
diagramHub.client.linkCreated = function (model) { var link = diagram.factory.createDiagramLink( findNode(model.originId), findNode(model.destinationId)); link.id = model.id; }; diagramHub.client.linkModified = function (model) { var link = findLink(model.id); link.setOrigin(findNode(model.originId)); link.setDestination(findNode(model.destinationId)); }; diagramHub.client.linkTextEdited = function (model) { var link = findLink(model.id); link.setText(model.text); };
Now the application will also synchronize link operations across all connected clients. Here’s a small diagram synchronized between three different browsers –
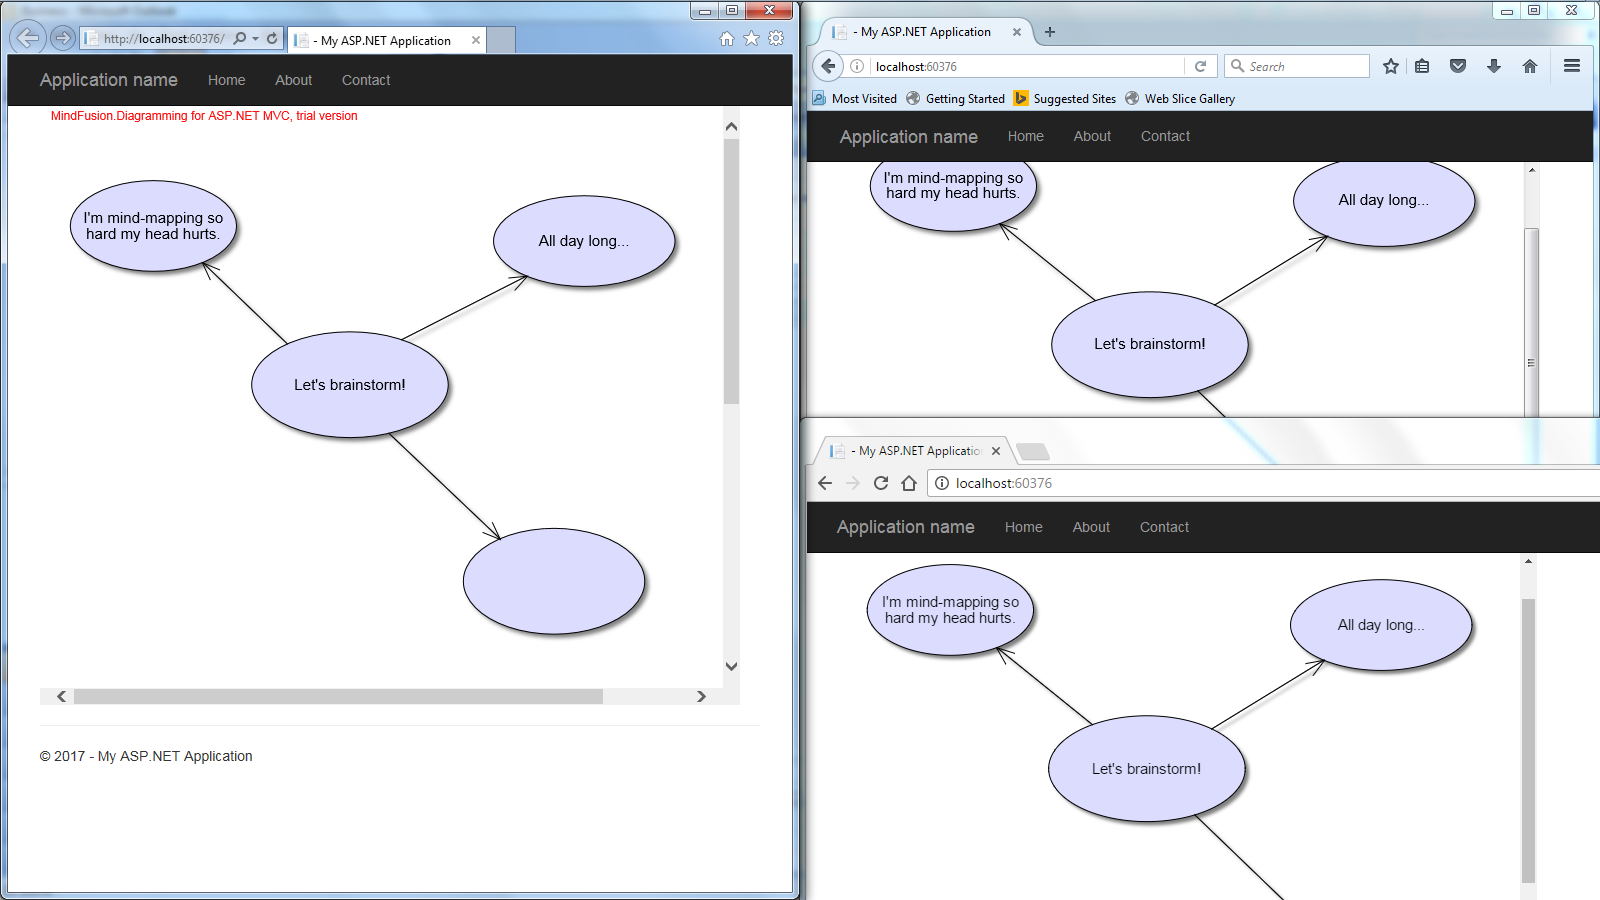
The sample above uses MindFusion’s ASP.NET MVC API. Code for other frameworks will look similar as MindFusion maintains same diagramming model for multiple platforms. You can download the trial version of any MindFusion.Diagramming component from this page.
Enjoy!
In this post we will show how to use the JavaScript diagram library to generate a class inheritance diagram. The complete example is available here:
and a live version here:
http://mindfusion.eu/demos/jsdiagram/Inheritance.html
Let’s start by creating shortcuts to some classes from the diagram model:
var Diagram = MindFusion.Diagramming.Diagram; var DiagramItem = MindFusion.Diagramming.DiagramItem; var DiagramLink = MindFusion.Diagramming.DiagramLink; var DiagramNode = MindFusion.Diagramming.DiagramNode; var ShapeNode = MindFusion.Diagramming.ShapeNode; var TableNode = MindFusion.Diagramming.TableNode; var ContainerNode = MindFusion.Diagramming.ContainerNode; var FreeFormNode = MindFusion.Diagramming.FreeFormNode; var SvgNode = MindFusion.Diagramming.SvgNode; var ScrollBar = MindFusion.Diagramming.ScrollBar; var Rect = MindFusion.Drawing.Rect; var Font = MindFusion.Drawing.Font; var TreeLayout = MindFusion.Graphs.TreeLayout;
Next, create a function that takes a Diagram instance and a list of class names as parameters. It will create a TableNode for each class. Each property of the class prototype is listed in a TableNode cell. If the getBaseType function detects a class inherits another one from the list, we’ll create a link between their nodes. Finally, the diagram is arranged using the TreeLayout algorithm.
function createClassDiagram(diagram, classes) { var classConstructors = []; // create a table node for each class for (var i = 0; i < classes.length; i++) { var className = classes[i]; var node = diagram.getFactory().createTableNode(20, 20, 42, 42); node.redimTable(1, 0); node.setText(className); node.setBrush("white"); node.setCaptionBackBrush("lightgray"); node.setCaptionFont( new Font("sans-serif", 3, true /*bold*/, true /*italic*/)); node.setScrollable(true); var ctor = eval(className); for (var property in ctor.prototype) { node.addRow(); node.getCell(0, node.rows.length - 1).setText(property); } classConstructors.push(ctor); ctor.classNode = node; } // create a diagram link for each prototype inheritance classConstructors.forEach(function(ctor) { var base = getBaseType(ctor); if (base && base.classNode) { var link = diagram.factory.createDiagramLink( base.classNode, ctor.classNode); link.setHeadShape(null); link.setBaseShape("Triangle"); link.setBaseShapeSize(3); } }); // arrange as a tree var treeLayout = new TreeLayout(); treeLayout.linkType = MindFusion.Graphs.TreeLayoutLinkType.Cascading; diagram.arrange(treeLayout); }
The getBaseType implementation checks if a class was registered as a base for the argument using MindFusion.registerClass method or the common prototype inheritance pattern.
function getBaseType(ctor) { // if class registered using MindFusion.registerClass if (ctor.__baseType) return ctor.__baseType; // if prototypical inheritance with Child.prototype = new Parent() if (ctor.prototype && ctor.prototype.constructor != ctor) return ctor.prototype.constructor; return null; }
The ready handler creates a Diagram instance binding it to a #diagram canvas element. It then calls createClassDiagram with a list of DiagramItem -derived classes as argument:
$(document).ready(function () { TableNode.prototype.useScrollBars = true; ScrollBar.prototype.background = "Lavender"; ScrollBar.prototype.foreground = "DarkGray"; // create a Diagram component that wraps the "diagram" canvas var diagram = Diagram.create($("#diagram")[0]); createClassDiagram(diagram, [ "DiagramItem", "DiagramLink", "DiagramNode", "ShapeNode", "TableNode", "ContainerNode", "FreeFormNode", "SvgNode" ]); });
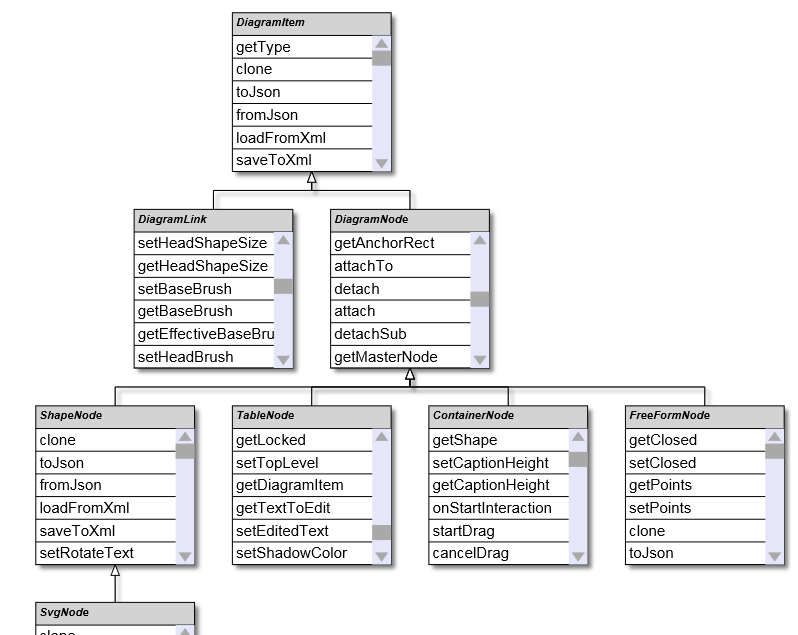
If you run the sample now, you should see this nice visualization of MindFusion classes 🙂
For more information on MindFusion JavaScript diagram library, see its help reference and overview page.
Enjoy!
MindFusion.Diagramming for JavaScript is now also available as a Node.js module, and you can use the diagram API you know and love in server code 🙂 A sample server application and the module script are available here:
For example, you can submit to server a diagram drawn interactively by the user and examine its contents there by iterating over the nodes and links members of the Diagram class:
// on client side $.ajax( { type: "post", url: "http://localhost:1234/diagram", contentType: "application/json", data: diagram.toJson(), success: function(data) { console.log('success'); }, error: function(jqXHR, textStatus, err) { console.log(err); } }); // on server side app.post('/diagram', function(req, res) { // won't be required in final release var dummyCanvas = { parentNode:{} }; // create Diagram instance var diagram = new Diagram(dummyCanvas); // load diagram elements drawn by user diagram.fromJson(req.rawBody); // examine diagram contents console.log(diagram.nodes.length + " nodes"); console.log(diagram.links.length + " links"); diagram.nodes.forEach(function (node, index) { console.log("node " + index + ": " + node.getText()); }); // send some response res.send('ok'); });
Or you could build the diagram on server side and send it to the browser to render in client-side Diagram control:
// on server side app.get('/diagram', function(req, res) { // won't be required in final release var dummyCanvas = { parentNode:{} }; // create Diagram instance var diagram = new Diagram(dummyCanvas); // create some diagram items var node1 = diagram.getFactory().createShapeNode(10, 10, 40, 30); var node2 = diagram.getFactory().createShapeNode(60, 10, 40, 30); var link = diagram.getFactory().createDiagramLink(node1, node2); // set nodes' content node1.setText("node.js"); node1.setBrush("orange"); node2.setText("hello there"); // send diagram json res.send( diagram.toJson()); }); // on client side $.ajax( { type: "get", url: "http://localhost:1234/diagram", success: function(data) { diagram.fromJson(data); }, error: function(jqXHR, textStatus, err) { console.log(err); } });
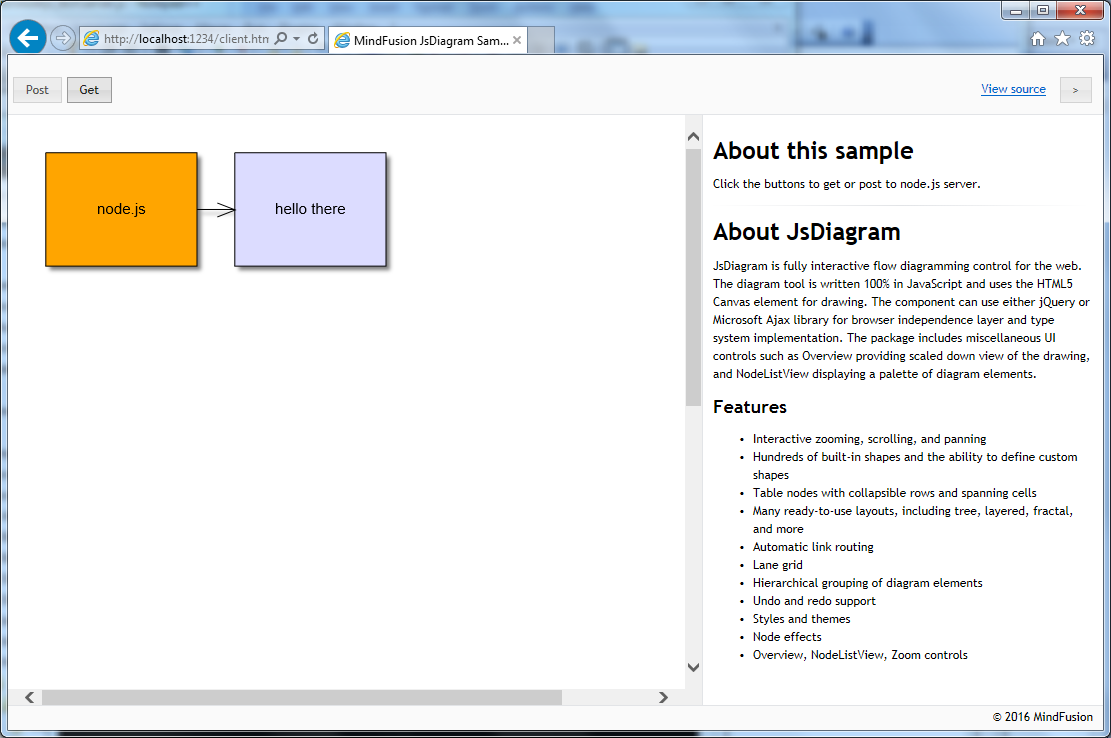
To run the sample Node.js application, run “node server.js” from command line and open http://localhost:1234/client.html in your browser. Draw some nodes and links, edit their text and click Post to see them enumerated in Node’s console. Clicking the Get button will show this diagram built on server side:
For more information on MindFusion’s JavaScript Diagram API, see MindFusion.Diagramming online help
Enjoy!
MindFusion suite of WinForms controls has just been released and boasts a variety of new features to make you build WinForms applications faster and easier. Here is a review of the new version:
MindFusion.Charting
New data model
Data that should be drawn in charts is read through an interface called Series, whose instances can be assigned to the Series properties of Chart and SeriesRenderer classes. You can implement this interface in your own model classes to avoid duplicating data. The library includes several pre-defined series classes that let you specify data via IList or array objects.
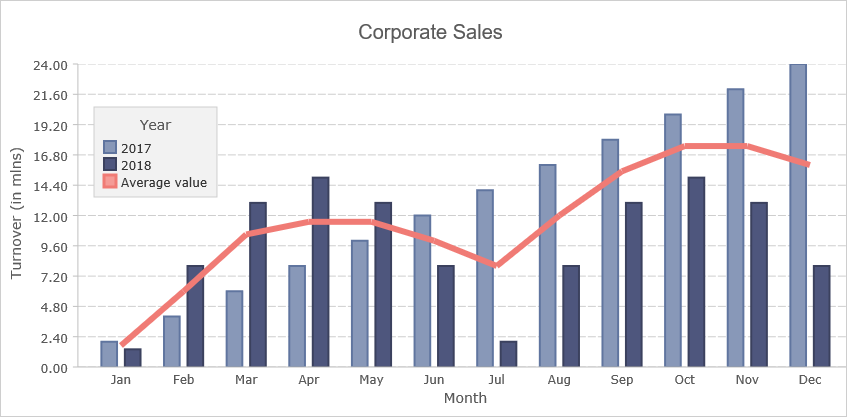
The new data model allows adding different series types to a single plot
New rendering model
Chart graphics are drawn inside Plot components by SeriesRenderer-derived objects. Each plot can contain multiple series renderers from same or different types. For example, you can draw area, line and bar graphics in same plot by adding AreaRenderer, LineRenderer and BarRenderer objects to its SeriesRenderers collection. Chart controls automatically generate a series renderer of appropriate type for their Series.
Dashboard
The Dashboard control can contain multiple plots, axes, legends, images, gauges and text blocks arranged in dynamic layout. Individual components can be added to dashboard’s default RootPanel or LayoutPanel containers, or for more complex layouts add intermediary panels such as GridPanel and StackPanel to the default ones. To show different types of chart graphics, add Plot2D to draw in 2D Cartesian coordinate system, Plot3D for 3D Cartesian system, and PolarPlot for polar coordinate system. To draw horizontal or vertical axes, add respectively XAxisRenderer and YAxisRenderer objects. To show gauges, add LinearGaugeRenderer or OvalGaugeRenderer, whose Gauge property contains the gauge model definition.
The new WinForms Chart has a built-in dashboard control.
Print and export
The Dashboard control and Chart controls that derive from it expose Print and PrintPreview methods for printing on paper. Call the ExportImage and CreateImage methods to generate bitmap image of the dashboard. The ExportPdf method exports the chart to a PDF (Portable Document Format) file. The ExportSvg method exports the chart to an SVG (Scalable Vector Graphics) file.
Styling
Values of appearance properties can come from several places in the component hierarchy. SeriesRenderer-derived objects can use attributes from their local SeriesStyle, from plot’s SeriesStyle, or from the *Series properties in current Theme. Component classes use either their local properties or ones defined in the theme. By default, appearance properties in SeriesRenderer > and Component > classes have null values, which makes the drawing code use values from the theme.
A rich choice of styling options are available
MindFusion.Diagramming
Free-form nodes
A FreeFormNode collects all points from users’ mouse or touch input and displays them as node’s outline. To let users draw free-form nodes interactively, set Behavior to DrawFreeForms or LinkFreeForms. Use the Points property of FreeFormNode to get or set outline points programmatically. If the Closed property is set, the node is drawn as a closed shape and its interior filled, or otherwise the node is drawn as a poly-line. If the distance between first and last points drawn by user is shorter than AutoCloseDistance, the node’s Closed property is automatically set to true.
Free form nodes: just draw the node with the mouse and the control understands the shape you want
LinkLabel edit events
LinkTextEditing and LinkTextEdited events are now raised also when the user edits a LinkLabel. The Label property of the respective event-arguments class identifies the LinkLabel that is being edited. Label is a null reference if the user is editing link’s Text value.
MindFusion Virtual Keyboard
MindFusion Virtual Keyboard has been initially added to MindFusion Pack for WinForms.
The WinForms virtual keyboard control: extended layout
MindFusion.Reporting
Improved charts
MindFusion.Reporting now uses the new MindFusion charting engine to display charts in reports. The presentation of the charts has been greatly improved (particularly when resizing the charts).
Pie charts in a WinForms report
MindFusion.Spreadsheet
New and improved charts
MindFusion.Spreadsheet now uses the new MindFusion charting engine to display charts in worksheets. Along with the improved appearance (particularly when resizing the charts), the following new features have been added:
Zoom
The worksheets can now be zoomed in and out through the new Zoom property.
The new chart engine makes spreadsheets even more appealing
MindFusion clients can download the installer for the latest version from the clients area on MindFusion website.
A direct link to download the WinForms pack is available from here:
Download MindFusion WinForms Pack 2016.R2
Updated assemblies are also available as MindFusion.Pack NuGet package.
About MindFusion.WinForms Pack: A rich set of programming components that provide WinForms developers with the complete list of features to build even the most complicated business applications fast and easy. The components integrate seamlessly and provide with a mouse click functionality that takes months to develop. Each control boasts various samples and tutorials, extensive documentation and numerous customization options that make it suitable for every type of software and scenario.
Further details about each component in the pack are available from MindFusion website:
Use this link to buy a license online. All components are royalty-free.