Lane diagram in JavaScript

In this post we will show how to use the JavaScript diagram library to create a lane diagram. The complete example is available here:

Lanes.zip

Create a new HTML page and add references to the jQuery library and to the MindFusion.Diagramming library:

<script src="jquery.min.js" type="text/javascript"></script>
<script src="MindFusion.Common.js" type="text/javascript"></script>
<script src="MindFusion.Diagramming.js" type="text/javascript"></script>

Create shortcuts to some classes from the diagram model:

var Events = MindFusion.Diagramming.Events;
var Diagram = MindFusion.Diagramming.Diagram;
var AnchorPattern = MindFusion.Diagramming.AnchorPattern;
var AnchorPoint = MindFusion.Diagramming.AnchorPoint;
var Alignment = MindFusion.Diagramming.Alignment;
var MarkStyle = MindFusion.Diagramming.MarkStyle;
var Style = MindFusion.Diagramming.Style;
var Theme = MindFusion.Diagramming.Theme;
var LinkShape = MindFusion.Diagramming.LinkShape;
var Shape = MindFusion.Diagramming.Shape;
var LaneGrid = MindFusion.Diagramming.Lanes.Grid;
var LaneHeader = MindFusion.Diagramming.Lanes.Header;
var LaneStyle = MindFusion.Diagramming.Lanes.Style;
var Rect = MindFusion.Drawing.Rect;
var Point = MindFusion.Drawing.Point;
var HandlesStyle = MindFusion.Diagramming.HandlesStyle;

Next, add a canvas the the page and create a diagram from it by using the Diagram.create() method:

diagram = Diagram.create($("#diagram")[0]);

You can obtain a reference to the diagram lane grid by calling the Diagram.getLaneGrid() method. You can use the returned object to add rows and columns to the grid and customize its appearance. Finally, to display the grid, call Diagram.setShowLaneGrid(). The customization is omitted here for brevity, but the full code is available in the associated sample project.

The lane grid implies some restrictions to the node and links inside of it. For example, the nodes can be moved only inside the row lanes of the grid. To enforce those restrictions, we will handle several diagram events:

diagram.addEventListener(Events.nodeCreated, onNodeCreated);
diagram.addEventListener(Events.nodeModified, onNodeModified);
diagram.addEventListener(Events.linkCreated, onLinkCreated);

In the nodeCreated event handler, get the gird cell at the top left of the node’s bounding rectangle and align the node to this cell:

function onNodeCreated(sender, e) {
    var node = e.getNode();
    node.setAnchorPattern(pattern);
    node.setHandlesStyle(HandlesStyle.HatchHandles3);

    // Place the box within the grid
    var bounds = node.getBounds();
    var topLeft = new Point(bounds.x, bounds.y);

    var cellBoundsReciever = {};
    if (!grid.getCellFromPoint(topLeft, cellBoundsReciever))
        return;
    var cellBounds = cellBoundsReciever.cellBounds;

    var pixel = 1;

    bounds.y = cellBounds.y + pixel;
    bounds.height = cellBounds.height - 2 * pixel;
    node.setBounds(bounds);
}

Similar rules can be applied to the links in the linkCreated event handler.

The following image illustrates the grid in action:

JavaScript Swimlane Diagram

For more information on MindFusion JavaScript diagram library, see its help reference and overview page.

Enjoy!

Design custom shapes with WPF Diagram

Watch here the video for this tutorial.

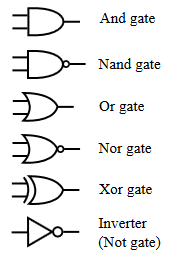
This tutorial will run you through the process of creating custom WPF diagram shapes using the built-in Shape Designer. Keep in mind that the Designer is intended as a sample and is limited in terms of functionality. The designer is available inside the installation of MindFusion.Diagramming for WPF but is also included in this tutorial for convenience. For the purposes of this tutorial, we will create an ‘AND Gate’ circuit diagram shape as illustrated by the following image:

Circuit shapes

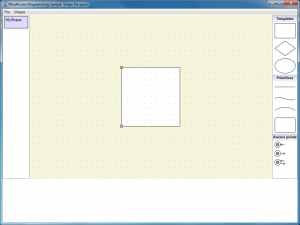
Run the Shape Designer application through the ShapeDesign.exe. The Shape Designer opens up with a single rectangular shape ready to be modified.

Diagramming WPF Circuit Shapes 1

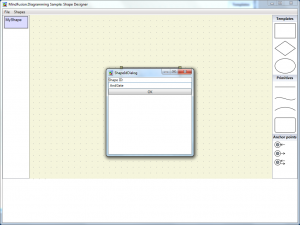
The Shape Designer does not currently support shape renaming (remember, it’s just a sample), therefore create a new shape through the Shapes menu and name it ‘AndGate’.

Diagramming WPF Circuit Shapes 2

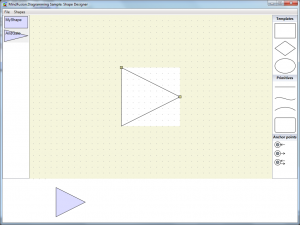
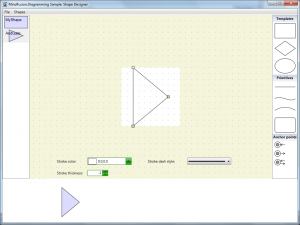
Select the newly created shape from the list on the left. In the editor select the right segment of the shape’s rectangle and press the DEL button on the keyboard. This will delete the segment and make the shape triangular.

Diagramming WPF Circuit Shapes 3

Adjust the end points of the shape segments so that it gets deflated on both sides. To adjust a segment, hover it with the mouse (so that its adjustment handles appear), then drag the handles.

Diagramming WPF Circuit Shapes 4

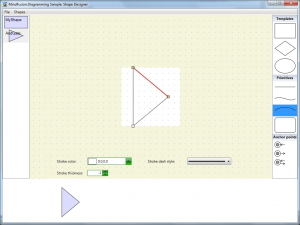
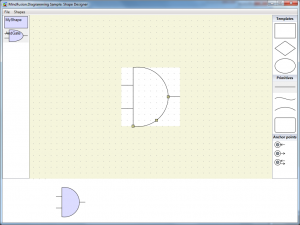
Select the arc primitive from the list on the right side of the screen. Drag this primitive over the top segment of the shape (until it gets highlighted in red) then drop.

Diagramming WPF Circuit Shapes 5

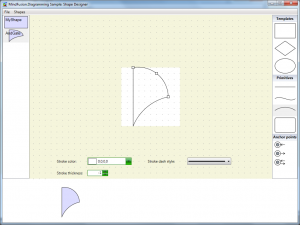
This will replace the line segment with an arc. Repeat the same process for the bottom segment of the shape.

Diagramming WPF Circuit Shapes 6

Adjust the middle point of both segments so that the shape looks protruded. Then drag three line primitives from the list on the right to the editor pane. Be careful not to drop the primitives over existing elements because this will replace the elements.

Diagramming WPF Circuit Shapes 7

Align the newly created line primitives with the existing shape.

Diagramming WPF Circuit Shapes 8

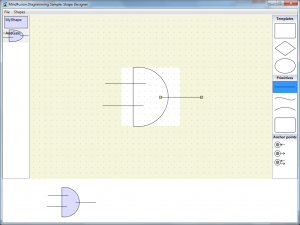
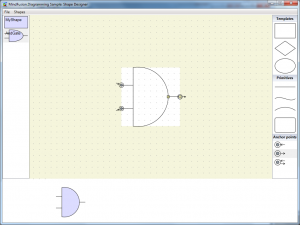
From the list with anchor points at the right side of the application, drag two anchor points from the first kind (input only) and one anchor point from the second kind (output only) and drop them inside the editor. Align the anchor points with the end points of the line segments created in the previous step.

Diagramming WPF Circuit Shapes 9

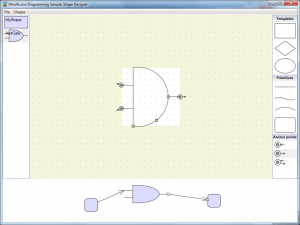
This will conclude the creation of the ‘AND Gate’ shape. You can test the shape in the preview diagram at the bottom of the screen.

Diagramming WPF Circuit Shapes 10

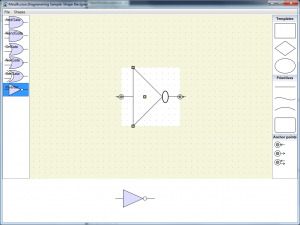
Save the shape library. Using the same approach, recreate the other circuit shapes from the image above. The following screenshot illustrates the complete library.

Diagramming WPF Circuit Shapes 11

The shape designer along with the shape library containing the circuit shapes can be downloaded from the link below:

Design Circuit Shapes

You are welcome to ask any questions about the WpfDiagram control at MindFusion discussion board or per e-mail at support@mindfusion.eu.

Click here here to visit the official page of the control.

We hope you find this tutorial useful and thank you for your interest in MindFusion developer tools.

MindFusion WinForms Spreadsheet Control: Convert XLSX to PDF

This blog demonstrates how easily you can convert XLSX files to PDF using the Windows Forms Spreadsheet control.

Setup

Create a new WinForms application and add the necessary assemblies to the project. Add a WorkbookView control to the main application window. Note, that this is not necessary for the conversion – it is done only to display the original XLSX file.

Perform the conversion

Add a button to the main form, set its text to ‘Convert…’ and handle its Click event. In the event handler display an OpenFileDialog to query the user for the input XLSX file, then display a SaveFileDialog to request the target PDF file. Once the two files are specified, proceed with the conversion by creating an ExcelImporter and PdfExporter objects and using their Import and Export methods in succession:

// Import the data
var importer = new ExcelImporter();
importer.Import(xlsxPath, workbook1);

// Export the worksheet as PDF
var exporter = new PdfExporter();
exporter.EnableGridLines = true;
exporter.Export(workbook1.Worksheets[0], pdfPath);

// Open the PDF
System.Diagnostics.Process.Start(pdfPath);

The xlsxPath and pdfPath variables identify the respective XLSX and PDF file names. The workbook1 variable represents the Workbook displayed on the form. Once the conversion is complete, the PDF file is opened in the default PDF viewer by calling Process.Start.

The following image illustrates the result:

The source code of the project together with all necessary libraries can be downloaded from here:

Convert .XLSX to .PDF Files Using the WinForms Spreadsheet Control: Download Sample

You are welcome to ask any questions about the WorkbookView control at MindFusion discussion board or per e-mail at support@mindfusion.eu.

Click here here to visit the official page of the MindFusion WinForms Spreadsheet control.

We hope you find this tutorial useful and thank you for your interest in MindFusion developer tools.

Custom Templates With the WPF Diagram Control

In this blog you will learn how to create a presentation of a hierarchical organization using MindFusion WPF Diagram control. The hierarchy is presented as a diagram, where each node represents an employee in the organization and each link represents the direct relationship between employees. The nodes in the diagram use custom templates to give a more detailed description of the employee, as well as to enable editing of various properties.

Setup

Create a new WPF application and add the necessary assemblies to the project. In the main window, declare the following namespace:

xmlns:diag="http://mindfusion.eu/diagramming/wpf"

Then declare an instance of the DiagramView class inside the root grid:

<diag:diagramview x:name="diagramView">
    <diag:diagram x:name="diagram" backbrush="White">
</diag:diagram></diag:diagramview>

Creating the custom node

To create the custom node, from the “Project -> Add New Item” menu add a new CustomControl (WPF) item to the project. This automatically creates a themes folder inside the project and a generic.xaml resource dictionary, which contains the template of the newly added class. Rename the newly created file (and class) to OrgChartNode. Ensure that the new class derives from TemplatedNode rather than Control. Then define the following dependency properties in the class: Title, FullName, and Image, of types string and ImageSource respectively.

Define the appearance of the node in its template in the generic.xaml file. In this case the node will display a round border, an image of the employee, its title, name, and description, and several buttons that can be used to change the role of the employee or add subordinates. The components bind directly to the properties of the node class. For example:

<textbox acceptsreturn="False" fontfamily="Verdana" fontsize="12" borderbrush="Transparent" background="Transparent" text="{Binding FullName}"></textbox>

The complete listing of the node’s template can be found in the project below.

To handle the Click event of the buttons in the template, register a routed event handler in the OrgChartNode class:

AddHandler(Button.ClickEvent, new RoutedEventHandler(OnClick));
...
void OnClick(object sender, RoutedEventArgs e)
{
    ...
}

Declare an Index property in the OrgChartNode class, which will indicate the role of the employee. Changing the role will automatically update the title and background color of the node:

public int Index
{
    get { return Images.IndexOf(Image); }
    set
    {
        if (value != -1)
        {
            Image = Images[value];
            Title = Titles[value];
            Brush = Fills[value];
        }
        else
        {
            Image = null;
        }

        InvalidateVisual();
    }
}

Create the hierarchy

Now that the custom node is ready, we can create a diagram representing the hierarchy. In the code behind of the main window, create a series of OrgChartNode objects, each representing an employee in the organization, then link the nodes using the CreateDiagramLink method of the diagram Factory class:

var node1 = new OrgChartNode
{
    Bounds = new Rect(0, 0, 300, 160),
    FullName = "Mike Powell",
    Text = "This is the leader of the sample organization.",
    Index = 2
};
diagram.Nodes.Add(node1);

var node2 = new OrgChartNode
{
    Bounds = new Rect(0, 0, 300, 160),
    FullName = "Emily Williams",
    Text = "Emily is the leader highest in the PR hierarchy.",
    Index = 1
};
diagram.Nodes.Add(node2);
...
diagram.Factory.CreateDiagramLink(node1, node2);

Finally, arrange the hierarchy by using the built-in tree layout:

TreeLayout layout = new TreeLayout();
layout.Type = TreeLayoutType.Centered;
layout.LinkStyle = TreeLayoutLinkType.Cascading3;
layout.Direction = TreeLayoutDirections.TopToBottom;
layout.KeepRootPosition = false;
layout.LevelDistance = 40;
layout.Arrange(diagram);

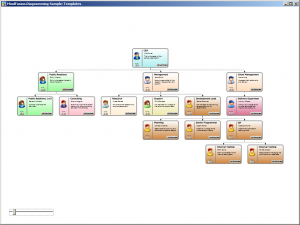
The following image illustrates the result:

Diagramming_Wpf_Templates

The source code of the project together with all necessary libraries can be downloaded from here:

Download Organization Hierarchy Sample

You are welcome to ask any questions about the Diagram control at MindFusion discussion board or per e-mail at support@mindfusion.eu.

Click here here to visit the official page of the WPF diagram control.

We hope you find this tutorial useful and thank you for your interest in MindFusion developer tools.

WinForms Spreadsheet Auto-Filtering

In this post we will discuss how to use the auto-filtering feature in MindFusion.Spreadsheet for WinForms.

Introduction

We start off by creating a new Windows Forms Application in Visual Studio, adding a WorkbookView control to the main form and adding the Northwind database (nwind.mdb) as a data source. For simplicity we only add the Orders table. After compiling the application we can add the DataSource and the OrdersTableAdapter as components to the main form.

Loading the data

We traverse the rows in the data source and populate the spreadsheet by assigning the data to the Data property of the respective worksheet cells. The first cell in each column is set to the name of the corresponding database field. Finally, the columns are resized to fit their contents through the ResizeColumnsToFit method of the view. The complete code of the data loading can be found in the LoadData method.

Turning auto-filtering on

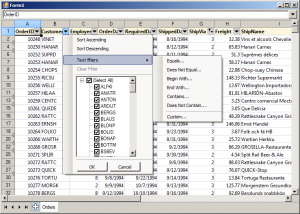
Auto-filtering is enabled by calling the AutoFilter method of the CellRange class. If the CellRange represents a range of cells, then auto-filtering is applied to that range. If the CellRange represents a single cell, then auto-filtering is applied to the rectangular area of data cells, which includes this cell. In this application, we enable auto-filtering on the loaded data, by calling AutoFilter on cell A1. In addition, we apply auto-filtering criteria on the 6-th column (ShipVia) by calling the AutoFilter overload.

workbook1.Worksheets[0].CellRanges["A1"].AutoFilter();
workbook1.Worksheets[0].CellRanges["A1"].AutoFilter(
    6, "<>1", AutoFilterOperator.Or, null, true);

The following image shows the running sample:
spreadsheet-autofilter

The source code is available for download from here:
https://mindfusion.eu/_samples/SpreadsheetAutoFilter.zip

MindFusion.Spreadsheet for WinForms can be downloaded from here:
MindFusion.Spreadsheet for WinForms

About MindFusion.Spreadsheet for WinForms: A powerful .net spreadsheet component with great capabilities for editing, styling and formatting large amounts of data.