Custom Templates With the WPF Diagram Control

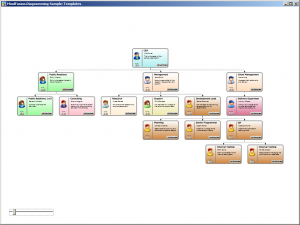
In this blog you will learn how to create a presentation of a hierarchical organization using MindFusion WPF Diagram control. The hierarchy is presented as a diagram, where each node represents an employee in the organization and each link represents the direct relationship between employees. The nodes in the diagram use custom templates to give a more detailed description of the employee, as well as to enable editing of various properties.

Setup

Create a new WPF application and add the necessary assemblies to the project. In the main window, declare the following namespace:

xmlns:diag="http://mindfusion.eu/diagramming/wpf"

Then declare an instance of the DiagramView class inside the root grid:

<diag:diagramview x:name="diagramView">
    <diag:diagram x:name="diagram" backbrush="White">
</diag:diagram></diag:diagramview>

Creating the custom node

To create the custom node, from the “Project -> Add New Item” menu add a new CustomControl (WPF) item to the project. This automatically creates a themes folder inside the project and a generic.xaml resource dictionary, which contains the template of the newly added class. Rename the newly created file (and class) to OrgChartNode. Ensure that the new class derives from TemplatedNode rather than Control. Then define the following dependency properties in the class: Title, FullName, and Image, of types string and ImageSource respectively.

Define the appearance of the node in its template in the generic.xaml file. In this case the node will display a round border, an image of the employee, its title, name, and description, and several buttons that can be used to change the role of the employee or add subordinates. The components bind directly to the properties of the node class. For example:

<textbox acceptsreturn="False" fontfamily="Verdana" fontsize="12" borderbrush="Transparent" background="Transparent" text="{Binding FullName}"></textbox>

The complete listing of the node’s template can be found in the project below.

To handle the Click event of the buttons in the template, register a routed event handler in the OrgChartNode class:

AddHandler(Button.ClickEvent, new RoutedEventHandler(OnClick));
...
void OnClick(object sender, RoutedEventArgs e)
{
    ...
}

Declare an Index property in the OrgChartNode class, which will indicate the role of the employee. Changing the role will automatically update the title and background color of the node:

public int Index
{
    get { return Images.IndexOf(Image); }
    set
    {
        if (value != -1)
        {
            Image = Images[value];
            Title = Titles[value];
            Brush = Fills[value];
        }
        else
        {
            Image = null;
        }

        InvalidateVisual();
    }
}

Create the hierarchy

Now that the custom node is ready, we can create a diagram representing the hierarchy. In the code behind of the main window, create a series of OrgChartNode objects, each representing an employee in the organization, then link the nodes using the CreateDiagramLink method of the diagram Factory class:

var node1 = new OrgChartNode
{
    Bounds = new Rect(0, 0, 300, 160),
    FullName = "Mike Powell",
    Text = "This is the leader of the sample organization.",
    Index = 2
};
diagram.Nodes.Add(node1);

var node2 = new OrgChartNode
{
    Bounds = new Rect(0, 0, 300, 160),
    FullName = "Emily Williams",
    Text = "Emily is the leader highest in the PR hierarchy.",
    Index = 1
};
diagram.Nodes.Add(node2);
...
diagram.Factory.CreateDiagramLink(node1, node2);

Finally, arrange the hierarchy by using the built-in tree layout:

TreeLayout layout = new TreeLayout();
layout.Type = TreeLayoutType.Centered;
layout.LinkStyle = TreeLayoutLinkType.Cascading3;
layout.Direction = TreeLayoutDirections.TopToBottom;
layout.KeepRootPosition = false;
layout.LevelDistance = 40;
layout.Arrange(diagram);

The following image illustrates the result:

Diagramming_Wpf_Templates

The source code of the project together with all necessary libraries can be downloaded from here:

Download Organization Hierarchy Sample

You are welcome to ask any questions about the Diagram control at MindFusion discussion board or per e-mail at support@mindfusion.eu.

Click here here to visit the official page of the WPF diagram control.

We hope you find this tutorial useful and thank you for your interest in MindFusion developer tools.

ASP.NET Org Chart with the Diagram Control

In this post you’ll learn how to create a beautiful organization chart where most of the work is done by the ASP.NET flowchart control. We’ll use the capabilities of the control to create nodes, where we’ll put an image and formatted text. We’ll create automatically links among the nodes and apply the tree layout algorithm to arrange the diagram. Let’s start.

I. Add the Necessary DLLs.

Create a new blank ASP.NET project and add those of the dll-s of the control that we need for this project:
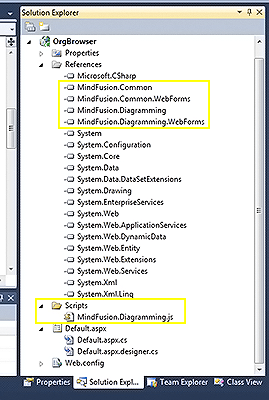
ASP.NET Diagram dll-s needed to build the the org chart

ASP.NET Diagram dll-s needed to build the the org chart

MindFusion.Diagramming, MindFusion.Diagramming.WebForms, MindFusion.Common, MindFusion.Common.WebForms. The asp.net diagram control needs the MindFusion.Diagramming.js file to render its contents. If you add it directly into the project’s folder you won’t have to add a reference to it. Since we create a ew project folder “Scripts” where we put it, we’ll have to reference it in code. We’ll talk about this in the next step.

II. Setup of the Diagram Control.

We add a new WebForm file to the project and into the HTML code we register the diagramming dll with the tag “ndiag”.

<%@ Register Assembly="MindFusion.Diagramming.WebForms" Namespace="MindFusion.Diagramming.WebForms" TagPrefix="ndiag" %>

We need a reference to a few *.js and *.css files as shown below:

<link href="common/jquery-ui.min.css" rel\="stylesheet">
<link href="common/samples.css" rel="stylesheet">
<script type="text/javascript" src="common/jquery.min.js"></script>
<script type="text/javascript" src="common/jquery-ui.min.js"></script>
<script type="text/javascript" src="common/samples.js">

The *.js files are located in a folder “common” in the project. Of course, you can reference them from their respective online locations.

Don’t forget the ScriptManager:

<asp:scriptmanager id="ScriptManager1" runat="server">

</asp:scriptmanager>

Now it’s time for the diagram – we add it in the HTML of the page using the “ndiag” tag that we’ve defined above.

<ndiag:diagramview id="fc" runat="server" clientsidemode="Canvas" style="position: absolute; left: 0px; top: 0px; right: 0px; bottom: 0px;" jslibrarylocation="Scripts/MindFusion.Diagramming.js" treeexpandedscript="onTreeExpanded">
      <diagram autoresize="RightAndDown" defaultshape="Rectangle" shapehandlesstyle="DashFrame">
</diagram></ndiag:diagramview>

The Diagram is in a DiagramView control that will render it contents. Node the “JsLibraryLocation” attribute – we use it to point to the location of the Diagramming.js file which we’ve placed in the Scripts folder in step 1.

III. Building the Diagram

We get the diagram object that we’ve defined in HTML like that:

Diagram diagram = fc.Diagram;

The data for the org chart is located in a XML file. The structure is something like this:

<employee>
  <name>Martin Larovsky</name>  
  <photourl>http://mindfusion.eu/_samples/ASP.NET_OrgChart/martin-larovsky.png</photourl>
  <title>COO</title>
  <level>Executive</level>
  <date>Aug 2015</date>  
    <employee>
      <name>Tanja Orsy</name>
..........................................

</employee></employee>

Each new hierarchy level is a list of Employee tags contained within the upper Employee node.

The first node is the top of the tree and we read it separately. First we open the XML document and then we get the first employee:

XmlDocument xmlDoc = new XmlDocument();
xmlDoc.Load("http://mindfusion.eu/_samples/ASP.NET_OrgChart/employees.xml");
XmlNode ceo = xmlDoc.SelectSingleNode("Employee");

We use the methods of the diagram control to create a new shape node and assign its properties to the data that we’ve read from the XML file:

ShapeNode root = diagram.Factory.CreateShapeNode(nodeBounds);
root.Text = "" + ceo["Name"].InnerText + " (" + ceo["Title"].InnerText + ") since " +
ceo["Date"].InnerText + ""; 
root.Shape = Shape.FromId("RoundRect"); 
root.TextPadding = new Thickness(0, 0, 3, 0); 
root.Brush = new MindFusion.Drawing.SolidBrush(Color.FromArgb(121, 109, 173)); 
root.TextFormat.Alignment = StringAlignment.Far; 
root.EnableStyledText = true; 
root.ImageUrl = ceo["PhotoUrl"].InnerText; 
root.ImageAlign = MindFusion.Drawing.ImageAlign.MiddleLeft;

The Factory class enables us to create different nodes within given bounds. HTML formatting of the text is supported because we have turned on the EnableStyledText property. The node shape is rounded rectangle for aesthetic reasons. The texi is aligned to the right and the image – to the left of the node. We use the ImageUrl property because the image is uploaded online and we just tell the ShapeNode from where to read it.

The nodes are read and created in a method that uses recurrence to cycle through all of them – you can see it in the sample. It has one line that’s worth noting:

//cycles through all nodes using recurrence and creates a DiagramNode for all employees
private void CreateChildren(Diagram diagram, DiagramNode parentDiagNode, XmlNode parentXmlNode)
{
foreach (XmlElement element in parentXmlNode.SelectNodes("Employee"))
{
.................................................................
diagram.Factory.CreateDiagramLink(parentDiagNode, node);

Note how we instruct the Factory to create a link between each node and its parent. This way we have the diagram ready.

IV. The Layout

If you run the application you’ll see just one node. It’s actually a pile of nodes. We need to arrange it but luckily the ASP.NET Diagram control has an impressive selection of layout algorithms. In our case the Tree layout is the perfect choice:

TreeLayout layout = new TreeLayout();
layout.Type = TreeLayoutType.Cascading;
layout.Direction = TreeLayoutDirections.LeftToRight;
layout.LinkStyle = TreeLayoutLinkType.Cascading2;
layout.NodeDistance = 3;
layout.LevelDistance = -8; // let horizontal positions overlap
layout.Arrange(diagram);

The TreeLayout class has plenty of customization options, here we have selected those that would make an org chart look best. You can experiment with the full set of options and see what looks right in your particular scenario.

Here is the final result:
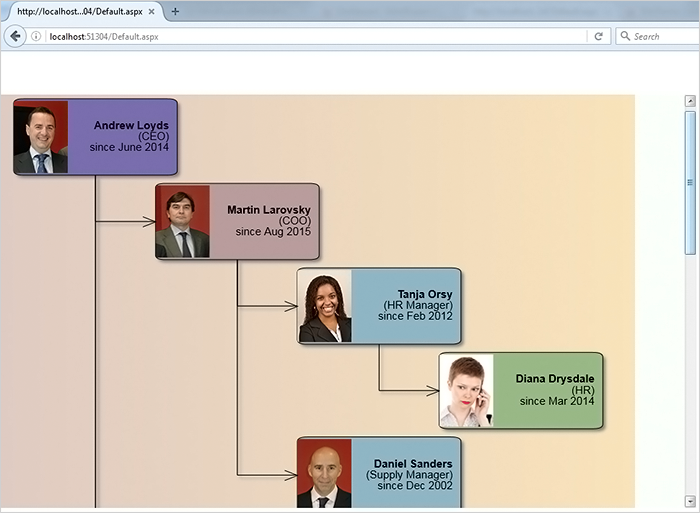
ASP.NET Org Chart

ASP.NET Org Chart

The source code of the project together with all necessary libraries and scripts can be downloaded from here:

Download ASP.NET Organization Browser Sample

You are welcome to ask any questions about the ASP.NET Diagram control at MindFusion discussion board or per e-mail at support@mindfusion.eu.

Click here to visit the official page of MindFusion ASP.NET Diagram Control.

We hope you find this tutorial useful and thank you for your interest in MindFusion developer tools.

Node.js diagram module

MindFusion.Diagramming for JavaScript is now also available as a Node.js module, and you can use the diagram API you know and love in server code 🙂 A sample server application and the module script are available here:

diagram_nodejs.zip

For example, you can submit to server a diagram drawn interactively by the user and examine its contents there by iterating over the nodes and links members of the Diagram class:

// on client side
$.ajax(
{
	type: "post",
	url: "http://localhost:1234/diagram", 
	contentType: "application/json",
	data: diagram.toJson(),
	success: function(data)
	{
		console.log('success');
	},
	error: function(jqXHR, textStatus, err)
	{
		console.log(err);
	}
});

// on server side
app.post('/diagram', function(req, res)
{
    // won't be required in final release
    var dummyCanvas = { parentNode:{} };

    // create Diagram instance
    var diagram = new Diagram(dummyCanvas);

    // load diagram elements drawn by user
    diagram.fromJson(req.rawBody);

    // examine diagram contents
    console.log(diagram.nodes.length + " nodes");
    console.log(diagram.links.length + " links");
    diagram.nodes.forEach(function (node, index)
    {
        console.log("node " + index + ": " + node.getText());
    });

    // send some response
    res.send('ok');
});

Or you could build the diagram on server side and send it to the browser to render in client-side Diagram control:

// on server side
app.get('/diagram', function(req, res)
{
    // won't be required in final release
    var dummyCanvas = { parentNode:{} };

    // create Diagram instance
    var diagram = new Diagram(dummyCanvas);

    // create some diagram items
    var node1 = diagram.getFactory().createShapeNode(10, 10, 40, 30);
    var node2 = diagram.getFactory().createShapeNode(60, 10, 40, 30);
    var link = diagram.getFactory().createDiagramLink(node1, node2);

    // set nodes' content
    node1.setText("node.js");
    node1.setBrush("orange");
    node2.setText("hello there");

    // send diagram json
    res.send(
        diagram.toJson());
});

// on client side
$.ajax(
{
	type: "get",
	url: "http://localhost:1234/diagram", 
	success: function(data)
	{
		diagram.fromJson(data);
	},
	error: function(jqXHR, textStatus, err)
	{
		console.log(err);
	}
});

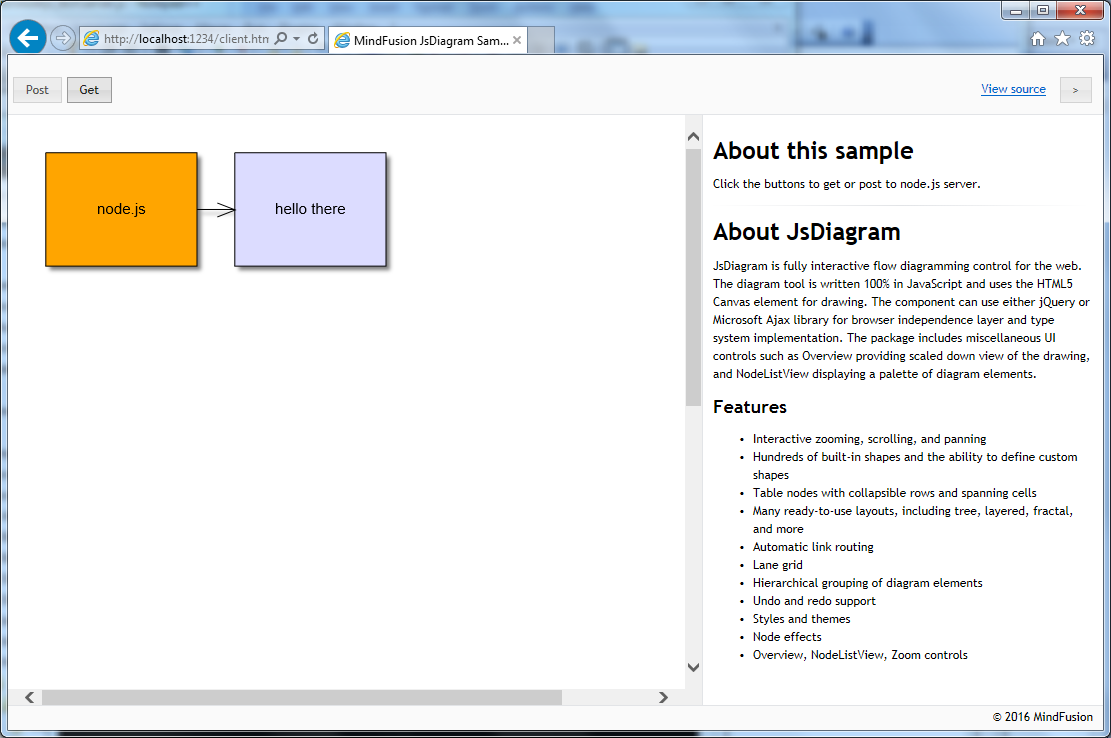
To run the sample Node.js application, run “node server.js” from command line and open http://localhost:1234/client.html in your browser. Draw some nodes and links, edit their text and click Post to see them enumerated in Node’s console. Clicking the Get button will show this diagram built on server side:

diagram built in node.js

For more information on MindFusion’s JavaScript Diagram API, see MindFusion.Diagramming online help

Enjoy!

MindFusion ASP.NET Diagram Control, V5.6

MindFusion is proud to present you with the new version of its ASP.NET diagram control.

Below you can read about the recently added features. As always, your questions are welcome. Use the technical support e-mail or MindFusion ASP.NET diagram forum.

Free-form nodes

A FreeFormNode collects all points from users’ mouse or touch input and displays them as node’s outline. To let users draw free-form nodes interactively, set Behavior to DrawFreeForms or LinkFreeForms.. Use the Points property of FreeFormNode to get or set outline points programmatically. If the Closed property is set, the node is drawn as a closed shape and its interior filled, or otherwise the node is drawn as a poly-line. If the distance between first and last points drawn by user is shorter than AutoCloseDistance, the node’s Closed property is automatically set to true. AutoCloseDistance  default value is float.MaxValue, so free-form nodes are always closed.

Free form nodes allow the user to draw diagram shapes with the mouse of the finger

Free form nodes allow the user to draw diagram shapes with the mouse of the finger

Convert free-form drawings to ShapeNodes

Additional drawing modes, convenient for touch input, convert FreeFormNode objects drawn by user to ShapeNode objects with matching shapes. To enable them, set Behavior to DrawFreeShapes or LinkFreeShapes. The shapes against which the user’s input is matched are set via diagram’s FreeFormTargets property. By default it contains Rectangle, Decision and Ellipse shapes.

Miscellaneous

  • NodePastedScript and LinkPastedScript client-side events raised when items are pasted from the clipboard.
  • PdfExporter now creates page hyperlinks if HyperLink is set to a value in “page://{number}” format, e.g. set “page://1” to open the second PDF page when the item is clicked
  • TypeScript definitions for the client-side Diagramming API are now provided in jsdiag.d.ts file.

Fixed bugs

  • CanvasVirtualScroll mode fixed for parent div size specified in percent units.
  • Fixed bug where the ExpandOnIncoming property specifying link direction for collapse/expand actions did not work correctly.
  • Removed several global JavaScript variables created inadvertently by the control.
  • Fixed bug where ShapeNodes’ Image did not zoom correctly in ImageMap mode for some ImageAlign values.

Installer for the latest version can be downloaded here, or from the clients area on our site:

Download MindFusion ASP.NET Diagram Control, V5.6 Trial

Updated assemblies and script files are also available as MindFusion.Diagramming.WebForms NuGet package.

About MindFusion ASP.NET Diagram Control: This is a reusable ASP.NET control that provides your WebForms application with the complete functionality to create, style and present flowcharts, hierarchies, trees, graphs, schemes, diagrams in the browser. You can leverage the large set of utility methods, path finding capabilities and cycle detection to build the perfect interactive diagram that supports plenty of UI features like tool tips, multiple selection, copy/paste to/from Windows clipboard and many more.

MindFusion ASP.NET control offers you more than 100 predefined node shapes, scrollable tables, 13 automatic layout algorithms, rich choice of pen and brushes and a long list of other options that will greatly shorten the time needed for developing an online business application that must implement diagramming features. MindFusion has built many different samples and tutorials that demonstrate the features of the control and give you abundance of sample code to copy and study. You can read more about the Diagram Control for ASP.NET here.

MindFusion JavaScript Diagram Library V2.6

MindFusion JavaSript Diagram Library has a new version. Here is an overview of the new features:

Free-form nodes

The new version lets you use a special, new type of nodes called FreeFormNode. In this case the control collects all points from users’ mouse or touch input and displays them as node’s outline. In order to allow users to draw free-form nodes interactively, set Behavior to DrawFreeForms or LinkFreeForms. The Points property of FreeFormNode allows you to get or set outline points programmatically. If the Closed property is set, the node is drawn as a closed shape and its interior filled, or otherwise the node is drawn as a poly-line.

Free form nodes allow the user to draw diagram shapes with the mouse of the finger

FreeFormNodes allow the user to draw diagram shapes with the mouse or the finger

Convert free-form drawings to ShapeNodes

This release introduces additional drawing modes, convenient for touch input. They convert FreeFormNode objects drawn by the user to ShapeNode objects with matching shapes. To enable them, set Behavior to DrawFreeShapes or LinkFreeShapes. The shapes against which the user’s input is matched are set via diagram’s FreeFormTargets property. By default it contains Rectangle, Decision and Ellipse shapes.

Miscellaneous

  • TypeScript definitions for the Diagramming API are now provided in jsdiag.d.ts file.
  • nodePasted and linkPasted events are now raised when new DiagramNode and DiagramLink instances are created from clipboard contents.
  • VirtualScroll mode fixed for parent div size specified in percent units.
  • Removed several global variables created inadvertently by the control.

A trial version is available for download here:

Download MindFusion Diagram Library for JavaScript, V2.6

About Diagramming for JavaScript Library: Written 100% in JavaScript, this tool is a dynamic, browser based visualization library that uses HTML5 Canvas to draw impressive diagrams, schemes, flowcharts, trees and many more. It is browser independent, easy to use and allows you to integrate interactive diagrams for JavaScript and HTML into any web application. This MindFusion graphing library supports a variety of predefined node shapes, customizable links, rich event set and many appearance options.

The user interaction model includes resizing / moving / selecting and modifying any diagram element. The library boasts an elegant API, which is documented in details, numerous step-by-step guides and tutorials. The Diagramming API also provides TypeScript definitions. Various samples are provided to let you learn quickly how to use the most important features of the library – check them here. The JavaScript diagram builder is not only the perfect choice for creating any type of diagram in the browser – it can also arrange it the way you wish with a mouse click using one of its automatic graph layout algorithms. For more details about the features of the component, please visit the Diagram for JavaScript page.