MindFusion has just released Diagramming for Wpf programming component v. 3.0.2. Most of the newly added features are requested by our customers. Here are details:
Visio 2003 Import
The new VisioImporter lets you import Visio 2003 XML Drawing files (*.vdx) into WpfDiagram. You can import all standard Visio flowchart shapes as well most of the UML and Database entity shapes. The shapes are imported to their closest representations in the MindFusion.Diagramming for Wpf object model. The relationships between the objects are preserved and the Visio links are imported as DiagramLink objects. Additionally, most of the attributes of the Visio objects such as text, text format, fill and line colour and style are preserved. WpfDiagram raises an event for each imported node and you can set the shape node if it is not recognized by the control or you want to change the shape.
The Import method imports all Visio pages into a DiagramDocument. A DiagramPage is created for each page from the VDX file. The new GetPageCount and ImportPage methods let you determine how many pages are in the Visio document and import only a single one. You can import all Visio pages into a single diagram.
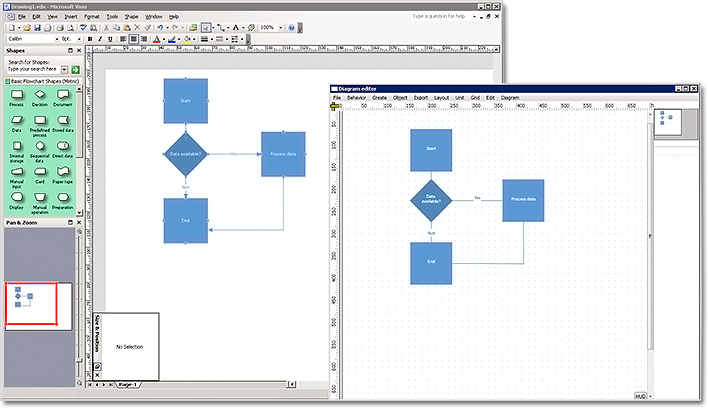
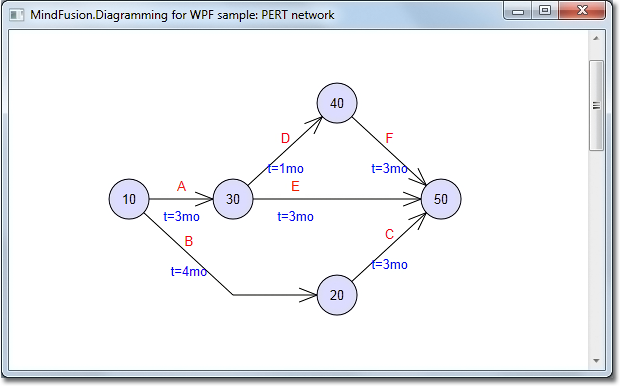
It is easy to import a diagram from Visio.
Miscellaneous
- The overload methods of AttachTo that attach node to link segments or control points, now let you specify negative index values. Negative values are interpreted as relative to the last point or segment, regardless of the current number of link segments.
- The handling of Clip paths in PdfExporter is improved.
- You can export the swimplane grid to Visio by setting the ExportLanes property of the VisioExporter.
- The Copy method lets you copy text attributes between objects that implement the ITextAttribute interface, such as diagram items table cells, tree items.
- as well other new features – check the full list here.

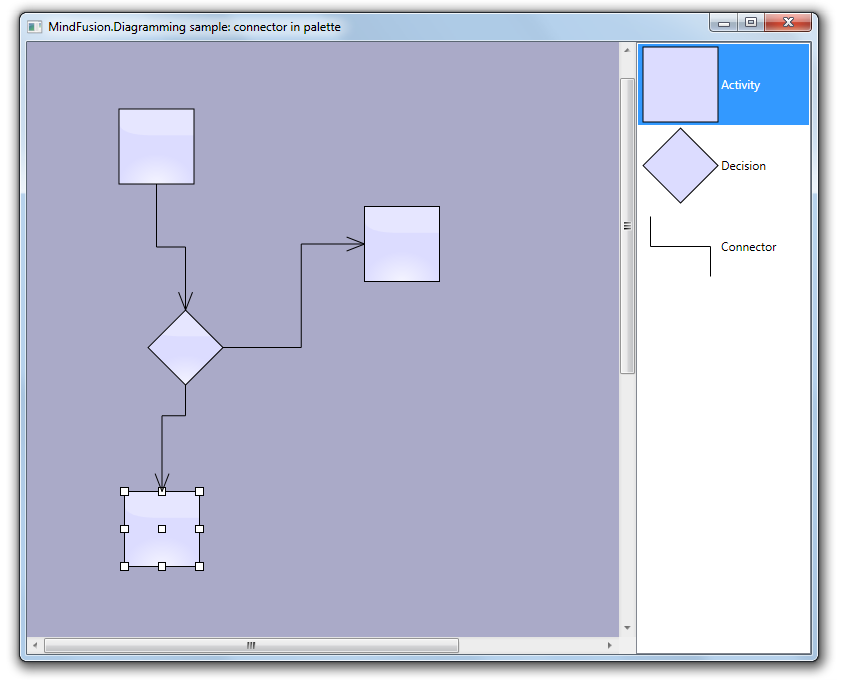
An arrow is shaped by its control points.
You can download the trial version of the software from this link:
Download MindFusion.Diagramming for WPF 3.0.2
The download contains all runtime libraries of the control, various samples for different .NET versions, extensive desktop documentation and step-by-step tutorials.
If you face difficulties installing or using Diagramming for Wpf, please contact MindFusion support team per e-mail or phone. You can also use the forum or help desk. All support inquiries are answered within hours of receiving them.
About MindFusion.Diagramming for Wpf: Designed and developed to be easy to integrate, use, and customize, this native WPF component places at your disposal every single feature you would ever need to create flowcharts, diagrams, graphs, schemes, DB relationships, trees and many more. Its long list of style options gives you complete control over the appearance of the diagram. With a set of eight automatic layouts you are sure to choose the best arrangement for your items and make the diagram easy to comprehend.
The control boasts a long list of events, properties and methods for user interaction, item creation, data input and output. You can read the full features list here. The online demo shows samples that demonstrate various capabilities of the control. The licensing scheme and prices are uploaded at the buy page. Source code is also available.