This is the second part of MindFusion step-by-step tutorial on how to create a Java application that reads the contents of a *.jar file and renders class diagram of its API. In the previous blog post we looked at the UI elements that build the application – the UI, the legend panel, the diagram elements. Now we continue with reading the class data and building the class diagram.
I. Reading the Data
The data that we need – the name of the API member, its fields, its type – enum, class, interface as well inherited classes – is stored in a helper class that we’ve created for the purpose and that is called MemberInfo.java. It is a simple class that does nothing else than storing data:
 public MemberInfo( String name, String fullName )
    {
        this.name = name;
        this.fullName = fullName;

        //lists for the methods, fields and constructors.
        methods = new ArrayList();
        fields = new ArrayList();
        constructors = new ArrayList();
        inheritsFrom = "";
        packageName = "";
        isInterface = false;
        isEnum = false;
    }
There is a list with the methods, fields and constructors, as well properties for the name of the package, the class this class inherits from as well boolean values that indicate if this is an enum or interface.
For reading the data we use only classes and methods from the official Java packages – no third party tools or libraries:
      try
        {
            //try to open the jar
            JarFile jarFile = new JarFile(pathToJar);

            //explore the elements found in the *.jar.
            Enumeration e = jarFile.entries();

            URL[] urls = {new URL("jar:file:" + pathToJar + "!/")};
            URLClassLoader cl = URLClassLoader.newInstance(urls);
            //if a class is found - read its data
            while (e.hasMoreElements())
            {
                JarEntry je = e.nextElement();
                if (je.isDirectory() || !je.getName().endsWith (".class")) {
                    continue;
                }
                // -6 because of .class file extension.
                String className = je.getName().substring(0, je.getName().length() - 6);
                className = className.replace('/', '.');
                .....
In a cycle we read all classes in the jar, parse the data we are interested in and filter data that is no relevant to us – private methods, abstract classes etc. The data we acquire for each class is stored in a new MemberInfo object that we add to a collection.
II. Diagram Elements
The diagram elements that we use to render each class are TableNode-s. We use the caption field to show the name of the class. In addition, we use the capabilities of the Java diagram library to render formatted text and add to the caption the name of the package – drawn on a new line.
            //create the TableNode
            TableNode _table = diagram.getFactory().createTableNode(10, 10, 5, 5, 2, info.memberCount());
            //set the name of the member and the package as table caption.
            String caption = "" + info.getName() + "";
            if(info.getPackageName().length() > 0)
                caption += "\n" + info.getPackageName();
            _table.setCaption(caption);
            //center the caption
            _table.setCaptionFormat((new TextFormat(Align.Center, Align.Center)));
            //increase the default caption height
            _table.setCaptionHeight(10f);
           .....
It is important to note here that we add an identifier for each table – this will help us find the right TableNode when we later create connections:
_table.setId(info.getFullName());
By default TableNode-s are drawn with blue. We check if the current object is enum or interface and change the color scheme accordingly:
            //add enums to the list and paint them green
            if(info.isEnum()) {
                _table.setBrush(new SolidBrush(new Color((int) 210, (int) 250, (int) 208)));
                enums.add(_table);
            }//add interfaces to the list and paint them yellow
            else if(info.isInterface()) {
                _table.setBrush(new SolidBrush(new Color((int) 250, (int) 235, (int) 140)));
                interfaces.add(_table);
            }
            else //the class nodes are blue
                _table.setBrush(new SolidBrush(new Color((int)197, (int)223, (int)238)));
Then we add table rows for the constructors, methods and fields. Each row has a cell for the image and for the definition of the member:
            //fill the first cells with data for the constructors.
            for (String constructor : info.getConstructors())
            {
                _table.getCell(0, index).setImage(constructorImage);
                _table.getCell(1, index).setText(constructor);
                index++;
            }
Finally, we look at all MemberInfo objects and draw DiagramLink between each class and the class it derives from, if any:
  for (MemberInfo info : membersList)
        {
            if(!info.getParent().isEmpty())
            {
                DiagramNode node = diagram.findNodeById (info.getFullName());
                DiagramNode parent = diagram.findNodeById( info.getParent());

                //add inheritance link
                if(node != null && parent != null)
                {
                    DiagramLink link = diagram.getFactory ().createDiagramLink(node, parent);

                .......
III. Containers
Interfaces and enums are drawn in groups at the end of the TableNode-s for classes. This is done using ContainerNode-s. First, we calculate the dimensions of the ContainerNode by measuring all TableNode-s that must fit into it:
            //calculate the location of the node
            int side = (int)Math.ceil(Math.sqrt(tables.size()));
            int rows = (int)Math.ceil((double)tables.size() / side);
            double singleWidth = tables.get(0).getBounds().getWidth();
            double width = 5 * (side + 1) * coef + singleWidth * side;
            double height = (5 * (rows + 1) + 5) * coef;

            double[] rowHeights = new double[rows];
            for (int i = 0; i < tables.size(); i++)
                rowHeights[i / side] = Math.max(tables.get(i).getBounds().getHeight(), rowHeights[i / side]);

            for (double h : rowHeights)
                height += h;


            //initialize the container
            ContainerNode b = diagram.getFactory().createContainerNode (0, 0, width, height);
            ....
Here the variable tables is a list with the TableNode-s that must fit into the container. After the ContainerNode is created, the tables must be added and positioned in it:
            int index = 0;
            for (TableNode e : tables)
            {
                b.add(e);

                double x = (index % side) * (5 + singleWidth);
                double y = 0;

                for (int r = 0; r < index / side; r++)
                    y += 5 * coef + rowHeights[r];

                //adjust the size of the node
                e.setBounds(new Rectangle2D.Double(x + 5 * coef, y + 10 * coef,                   e.getBounds().getWidth(), e.getBounds ().getHeight()));

                index++;
            }
Finally we adjust the appearance of the ContainerNode to make it look better and in line with the TableNode-s:
            //customize the container
            b.setCaption(name);
            b.setCaptionFormat((new TextFormat(Align.Center,  Align.Center)));
            b.setHandlesStyle( HandlesStyle.HatchHandles3 );
            b.setFont(new Font("Verdana", Font.BOLD, 4));
            b.setIgnoreLayout(true);
            b.setTag(tag);
            //no shadow
            b.setShadowOffsetX(0f);
            b.setShadowOffsetY(0f);
It’s important to note that the bounds of the container must be updated for the changes to take effect:
            //update the container size.
            b.updateBounds();
IV. Diagram Layout
The last part of the application deals with diagram layout. This is very important because in the common scenario we expect to read *.jar files with tens of classes and proper visual arrangement of the flowchart is the key to its usability.
We decide to use the TreeLayout, which is meant exactly to arrange diagrams with nodes on several levels as we expect the class hierarchies to be. It is easy to apply the layout – we create an instance of it and after setting some initial customization we call its arrange method:
TreeLayout layout = new TreeLayout();
//the layout type is Centered
layout.setType(TreeLayoutType.Centered);
//allow reversed links
layout.setReversedLinks(true);
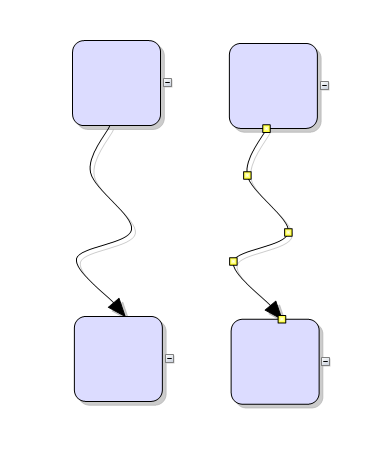
//the type of links will be cascading
layout.setLinkStyle(TreeLayoutLinkType.Cascading3);
//specify the distance between levels of tree nodes
layout.setLevelDistance(25);
//groups must be preserved.
layout.setKeepGroupLayout(true);
layout.arrange(diagram);
It is easy to understand the type of the settings we’ve used – thanks to the self-explanatory names of the layout class you can see that we specify that the TreeLayout will be centered, the links will be reversed, then we change the link style and the distance between levels. Finally, we specify that the layout of groups must be preserved.
The interesting part is at the end. We must find the ContainerNode-s with the enums and interfaces and move them to the end of the diagram. Here is how:
        // Place enums and delegates at the end
        DiagramNode enums = diagram.findNode(":enums");
        DiagramNode delegates = diagram.findNode(":interfaces");

        double x = 0;
        //calculate the location of each node to find out the last one
        for (DiagramNode node : diagram.getNodes())
        {
        	if (node instanceof TableNode)
            {
        		x = Math.max(x, node.getBounds().getX() +  node.getBounds().getWidth());
            }
        }

        //move enums to the right of the last class node.
        if (enums != null)
        {
            enums.moveTo((float)x + 5f, (float)5);
            x = enums.getBounds().getX() + enums.getBounds().getWidth ();
        }

        if (delegates != null)
        {
            delegates.moveTo((float)x + 5, 5);
        }
We cycle through each TableNode and always move the containers to the end of the rightmost TableNode that we find. Let’s not forget to resize the diagram after we are done:
diagram.resizeToFitItems(5);
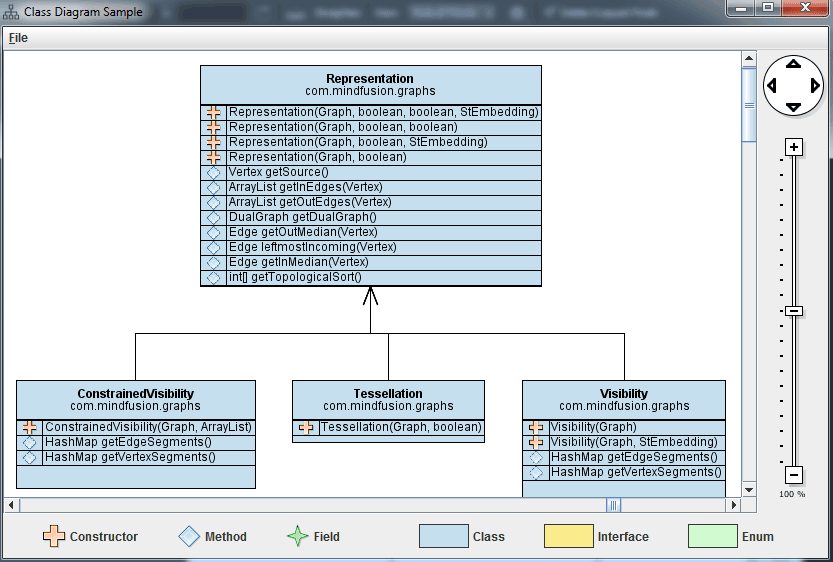
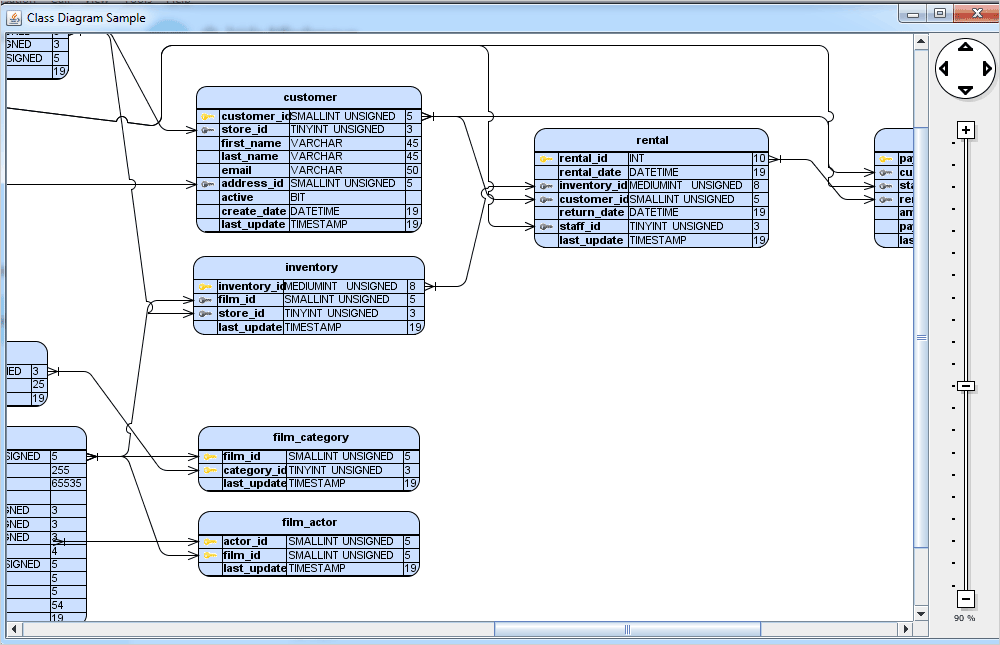
With this our application is ready and we test it with an arbitrary *.jar file. Here is the result:
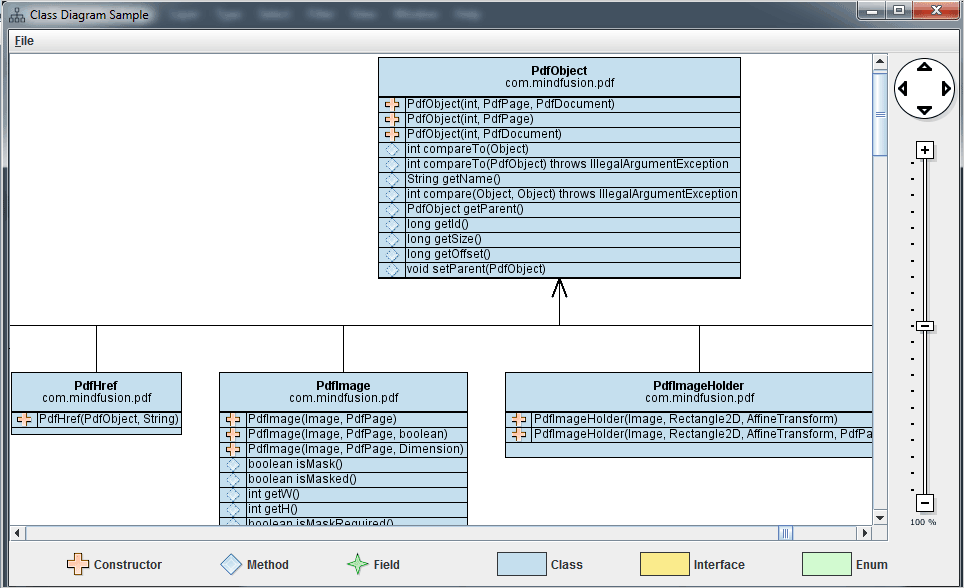
Class Diagram Application in Java
You can download the complete source code of the sample from here:
Download the Class Diagram Tool in Java Application
MindFusion support team welcomes your questions about the Java diagram library or any other of our programming tools at the discussion board or per e-mail at support@mindfusion.eu
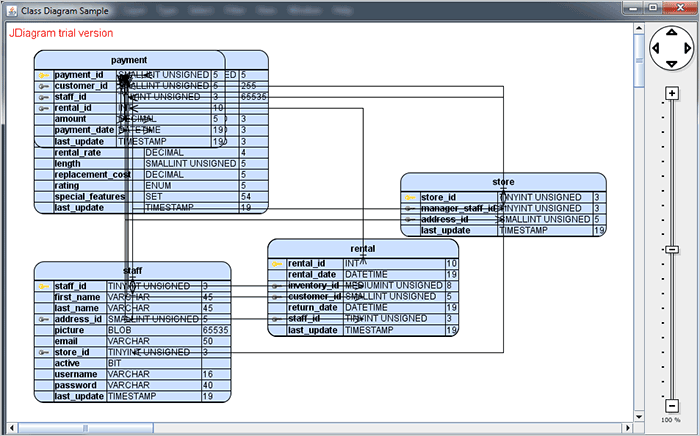
About Diagramming for Java Swing: MindFusion.Diagramming for Java Swing provides your Java application with all necessary functionality to create and customize a diagram. The library is very easy to integrate and program. There are numerous utility methods, rich event set, more than 100 predefined shapes. The tool supports a variety of ways to render or export the diagram, advanced node types like TreeView nodes, hierarchical nodes, tables, container nodes and many more. There are 15 automatic layouts, various input / output options and fully customizable appearance. A detailed list with JDiagram’s features is uploaded here. You can check the online demo to see some of the functionality implemented.
Diagramming for Java Swing is royalty free, there are no distribution fees. Licenses depend on the count of developers using the tool – check here the prices.