MindFusion.WebForms Pack, 2015.R1

MindFusion announceс а неш release of our WebForms suite of components. Here is an overview of the most important new features:

Licensing

We no longer make separate trial build of the control assemblies. Instead there is a new LicenseKey property, which disables a component’s evaluation mode. If your application contains more than one control by MindFusion, you could call MindFusion.Licensing.LicenseManager.AddLicense(key) to specify the key once instead of setting it per each control. License key strings are listed on the Keys & Downloads page at MindFusion’s customer portal.

Zoom control

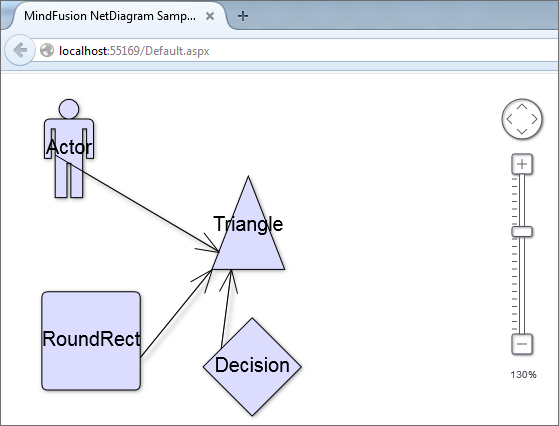
The ZoomControl class from MindFusion.Common.WebForms lets users change interactively the current zoom level and scroll position of a DiagramView or a MapView. To set it up, add a ZoomControl element to the page and set the control’s TargetId property to the id of the view. The control has numerous properties for customizing its appearance.

ASP.NET Diagrammer: The Zoom control

ASP.NET Diagrammer: The Zoom control

Visual Studio 2015 Toolbox Support

MindFusion.WebForms components can now be installed automatically into Visual Studio 2015 toolbox palette.

chartMindFusion.Charting

Custom Formatting of Labels for Line charts

Line charts now support custom formatting of labels. To use custom formatting, set LabelFormat to NumberFormat.Custom and use LabelCustomFormat.

Sorted Bars

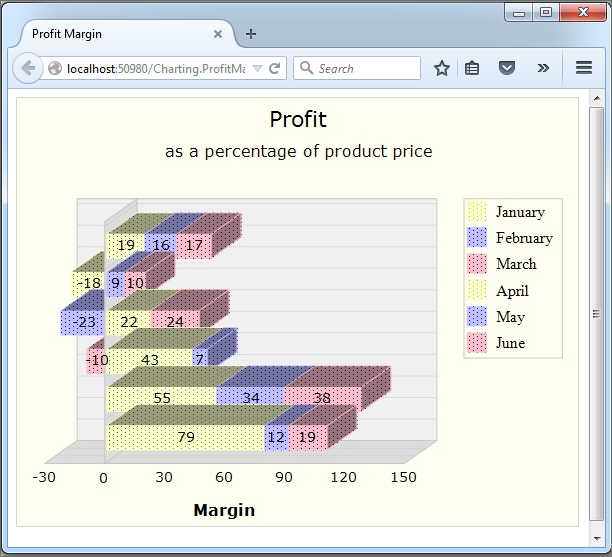
The algorithm for sorting of bars has been improved. Bars in a series or in clusters can be sorted in ascending or descending order – use the SortOrder property. You can also sort each series/cluster with the SortSeriesBy property. Bar can be sorted with their colors preserved if SortColor is set to true.

ASP.NET Chart: The Bar chart control

ASP.NET Chart: The Bar chart control

MindFusion WebForms DiagrammerMindFusion.Diagramming

Canvas mode improvements

  • Shape property of TableNode and ContainerNode is now supported in Canvas mode.
  • CellFrameStyle and EnableStyledText properties of TableNode are now supported in Canvas mode.
  • CellTextEditedScript event raised when users edit the text of table cells.
  • CreateEditControlScript event lets you create custom DOM element or fragment to use as in-place text editor.
  • NodeListView raises nodeSelected event when the user selects a node.
  • Load XML files from client side by calling loadFromXml method of Diagram class.
  • as well many more new properties and events.

Styled text in Canvas mode

The EnableStyledText property of ShapeNode allows using HTML-like formatting tags to apply various attributes to the node’s text. At this time the component supports the following formatting tags:

<b> specifies bold text
<i> specifies italic text
<u> specifies underlined text
<color=value> specifies text color
<br /> specifies line break

Zoom control

(not available in JavaApplet mode)
The ZoomControl class lets users change interactively the current zoom level and scroll position of a DiagramView. To set it up, add a ZoomControl element to the page and set the control’s TargetId property to the id of a DiagramView. The control offers numerous customization properties like ZoomStep, ScrollStep and various appearance setting properties such as Fill, BorderColor, CornerRadius and TickPosition.

WebForms Gauge Control by MindFusionMindFusion.Gauges

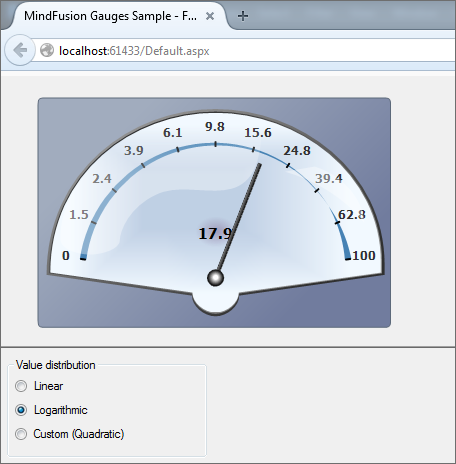
Linear and oval gauge controls have been added to MindFusion.WebForms pack. The gauges are drawn on client side using HTML Canvas API. Users can change gauge values interactively by dragging their elements.

The ASP.NET Gauge control

The ASP.NET Gauge control

WebForms Scheduler by MindFusionMindFusion.Scheduling

Horizontal Timetable view

Horizontal layout has been added to the Timetable view. The horizontal timetable view displays a collection of rows where each row represents the allotment of resources to distinct hours of a day; the rows in this view represent dates, tasks, locations, contacts or resources.

ASP.NET UI Suite of controlsMindFusion.UI

The bundled jQuery version has been upgraded to 1.11.2.

You can read further details about the release at the announcement page at MindFUsion discussion board.

The trial version of the new MindFusion.WebForms Pack is available for direct download from this link:

Download MindFusion ASP.NET Pack 2015.R1

About MindFusion.WebForms Pack: A set of WebForms components that add great variety of features to your ASP.NET application with a few mouse clicks. The pack contains advanced components for diagramming, scheduling, charting and UI (Accordion, ColorPicker, TabControl, Window, WindowHost, DockControl, Button, Slideshow, Zoom and more). Each tool boasts easy to learn and use API and is quickly integrated into any web application that targets the ASP.NET platform. The controls support numerous options for styling, data import / export, user interaction and offer rich event set. There are plenty of samples and step-by-step tutorials as well detailed documentation.

Use the features page for each of the tools to find out more about its capabilities and the numerous ways it can boost your performance and speed up the development of your application:

Visit the buy page for details on the licensing scheme and prices. If you have questions please contact us. We shall be happy to assist you.

MindFusion Controls on NuGet

All MindFusion components for WinForms, WPF and Silverlight are now available as NuGet packages. The following table lists the NuGet IDs of the individual products:

Product NuGet ID
MindFusion.Charting for WinForms
MindFusion.Diagramming for WinForms
MindFusion.Gauges for WinForms
MindFusion.Pack for WinForms
MindFusion.Reporting for WinForms
MindFusion.Scheduling for WinForms
MindFusion.Spreadsheet for WinForms
MindFusion.Charting
MindFusion.Diagramming
MindFusion.Gauges
MindFusion.Pack
MindFusion.Reporting
MindFusion.Scheduling
MindFusion.Spreadsheet
MindFusion.Charting for WPF
MindFusion.Diagramming for WPF
MindFusion.Gauges for WPF
MindFusion.Pack for WPF
MindFusion.Reporting for WPF
MindFusion.Scheduling for WPF
MindFusion.Spreadsheet for WPF
MindFusion.Charting.Wpf
MindFusion.Diagramming.Wpf
MindFusion.Gauges.Wpf
MindFusion.Pack.Wpf
MindFusion.Reporting.Wpf
MindFusion.Scheduling.Wpf
MindFusion.Spreadsheet.Wpf
MindFusion.Charting for Silverlight
MindFusion.Diagramming for Silverlight
MindFusion.Gauges for Silverlight
MindFusion.Pack for Silverlight
MindFusion.Reporting for Silverlight
MindFusion.Scheduling for Silverlight
MindFusion.Charting.Silverlight
MindFusion.Diagramming.Silverlight
MindFusion.Gauges.Silverlight
MindFusion.Pack.Silverlight
MindFusion.Reporting.Silverlight
MindFusion.Scheduling.Silverlight

The complete list of MindFusion products on NuGet can be found here: https://www.nuget.org/profiles/MindFusion.

The NuGet manager is available for Visual Studio 2010, Visual Studio 2012, and Visual Studio 2013 and can be downloaded from here: https://www.nuget.org/.

To install a package, run the following command in the Package Manager Console (accessible from the Visual Studio menu: Tools → NuGet Package Manager → Package Manager Console):

PM> Install-Package 

Where <id> is the NuGet ID of the package. For example, to install MindFusion.Diagramming for WinForms, use:

PM> Install-Package MindFusion.Diagramming

Enjoy!

MindFusion ASP.NET Pack 2014.R3 Released

MindFusion has just released a new version of its component suit for ASP.NET. The pack features a brand new mapping control and new features in most of the existing controls. Here are details:

DiagrammingMindFusion.Diagramming for WebForms

Zoom control
(not available in JavaApplet mode)
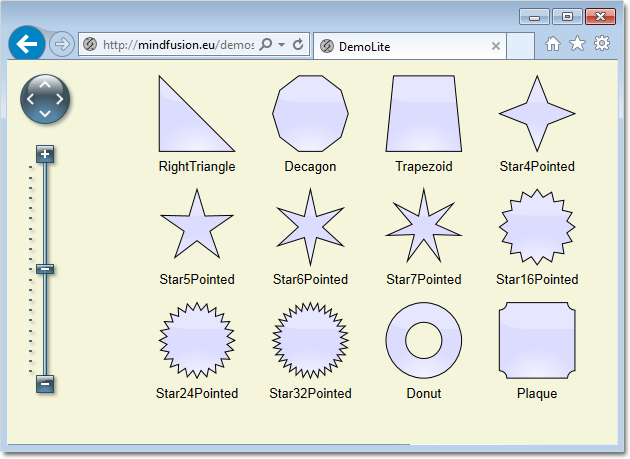
The ZoomControl class lets users change interactively the current zoom level and scroll position of a DiagramView. It’s very easy to set up a ZoomControl – just add the element to the page and set the control’s TargetId property to the id of a DiagramView. You can customize the control with the ZoomStep and ScrollStep properties. They let you specify how the diagram’s zoom level or scroll position are changed by the ZoomControl’s buttons. You can further customize the control’s appearance by setting properties such as Fill, BorderColor, CornerRadius and TickPosition.

The zoom control.

The zoom control.

Canvas mode improvements

  • The ShadowsStyle property is now supported in Canvas mode.
  • You can set the number of link segments from the client-side scripts by calling the setSegmentCount method.
  • The BackgroundImageAlign property is now supported in Canvas mode.
  • The TextPadding property of items is now supported in Canvas mode.
  • Nodes of all classes can be rotated.

Improved arrowhead rendering

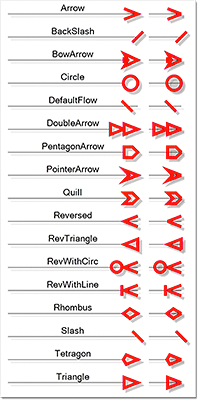
  • Arrowheads are rendered as a single path when possible and several arrowhead Shape definitions have been changed to implement mitered joints when HeadPen is set to a thick pen.
  • You can specify the point where end segments connect to arrowheads via the LinkSegmentInset property of shapes.
  • Arrowhead shadows are no longer filled if the link’s EffectiveBrush is null or fully transparent.
New vs. old arrowheads rendering

New vs. old arrowheads rendering

Miscellaneous

  • VisioExporter export speed has been improved greatly for large diagrams.
  • Improved DiagramLink rendering speed.
  • Multiple-resize of rotated nodes fixed to apply same offsets in nodes’ local coordinate system.
  • The Brush property of LinkLabel class lets you set background color for link labels.

Map-16x16MindFusion.Mapping for WebForms

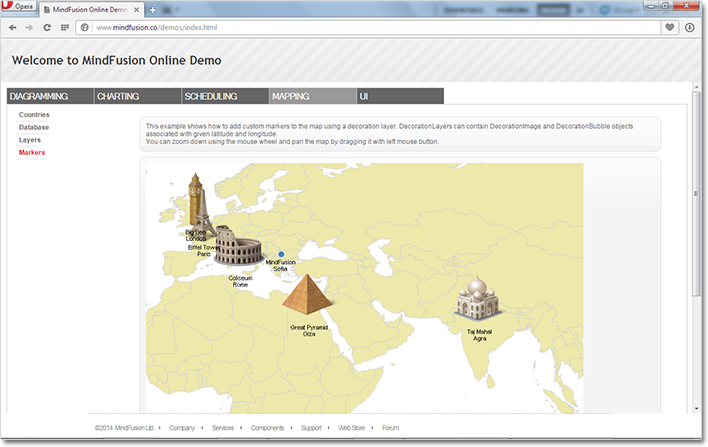
MindFusion.Mapping for WebForms comprises a .NET server control and a class library that provides your application with great features for loading, customizing and displaying any type of regional, national or world map. Easy to integrate and program, this control gives you the power to build the perfect map according to your needs with minimal time and efforts from your side. You can:

  • add labels to map elements
  • access database data associated with map elements
  • choose the color scheme
  • set decorative elements like images, icons etc.

Map data can be loaded from the popular ESRI Shapefile format and you have at your disposal an impressive variety of *.shp files, which give you valuable data for any country in the world as well for selected cities, rivers, roads and other geographic objects. Data for the attributes of map elements can be loaded from a DBF file associated with each map. The control supports multiple layers so you can show several maps in a single view.

The mapping control.

The mapping control.

MindFusion.UI for WebForms

Slider control
The new Slider control represents a range slider, which can be used to specify a numeric value constrained between a minimum and maximum.

A UI demo with the slider control.

A UI demo with the slider control.

The trial version is available for download from this link:

Download MindFusion ASP.NET Pack 2014.R3

About MindFusion.WebForms Pack: A set of WebForms components that add great variety of features to your ASP.NET application with a few mouse clicks. The pack contains advanced components for diagramming, scheduling, charting and UI (Accordion, ColorPicker, TabControl, Window, WindowHost, DockControl, Button, Slideshow, Zoom and more). Each tool boasts easy to learn and use API and is quickly integrated into any web application that targets the ASP.NET platform. The controls support numerous options for styling, data import / export, user interaction and offer rich event set. There are plenty of samples and step-by-step tutorials as well detailed documentation.

Use the features page for each of the tools to find out more about its capabilities and the numerous ways it can boost your performance and speed up the development of your application:

Visit the buy page for details on the licensing scheme and prices. If you have questions please contact us. We shall be happy to assist you.
Custom colors in maps

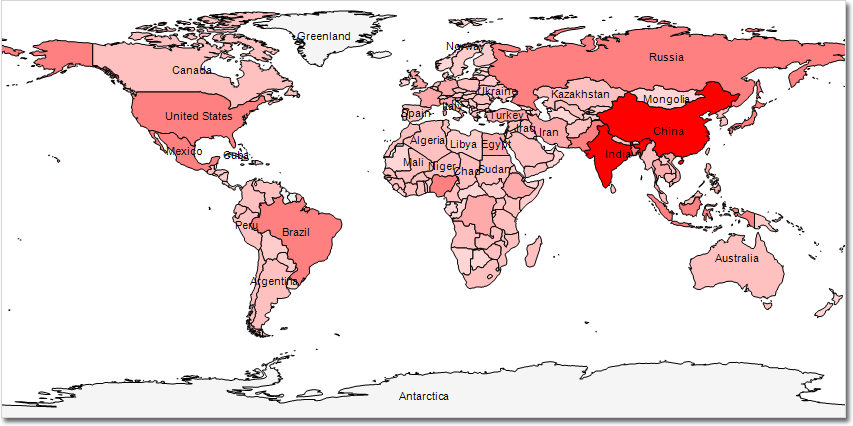
In a series of blog posts, we will explore various usage scenarios for MindFusion software components, based mostly on technical support questions we are frequently asked. Today’s post shows how to assign colors to map regions, depending on the value of a field in the map’s associated DBF database. This particular example assigns darker shades of red to countries with larger populations.

Let’s load an ESRI map file and its database into the map view’s BaseMap property, which provides a shortcut for setting a map in the first layer of the view:

// load the map file and dbf database
var map = mapView.BaseMap = Map.FromFile(
	"ne_50m_admin_0_countries.shp", true, "NAME");
var db = map.Database;
var layer = mapView.Layers[0];

Next, create an array of population threshold values, which will correspond to different values in the layer’s color palette:

// specify threshold values that trigger more saturated colors
var m = 1000000;
var populationThreshold = new[]
{
	0, 1*m, 5*m, 10*m, 50*m, 100*m, 1000*m
};

int numColors = populationThreshold.Length;

Define the map colors as shades of red:

// set the layer palette with a color for each threshold value
layer.FillColors = new Color[numColors];
layer.FillColors[0] = Color.WhiteSmoke;
for (int i = 1; i < numColors; i++)
{
	layer.FillColors[i] = Color.FromArgb(
		255,
		255 - 255 / (numColors - i),
		255 - 255 / (numColors - i));
}

Iterate over the database records, find their corresponding shape from the ESRI .shp file, and read the population field:

// for each database record, read population field and set color
for (int i = 0; i < db.Rows.Count; i++)
{
	var countryShape = map.Shapes[i];
	var population = float.Parse(db.Rows[i]["POP_EST"]);
	…
}

Finally, determine the shape’s color from the maximal threshold value smaller than the country’s population:

	for (int c = numColors - 1; c >= 0; c--)
	{
		if (population > populationThreshold[c])
		{
			countryShape.Color = c;
			break;
		}
	}

The resulting custom-colored map is shown in this screenshot:

Colored map
Labels for countries are displayed dynamically e.g. they are hidden if space is not enough. In the sample pictured above you will see all labels if you zoom in the map.

A VS2008 solution that includes the full source code and map files can be downloaded here:
https://mindfusion.eu/_samples/ColorCoding.zip

Enjoy!