Apply FractalLayout and SpringLayout to generate a tag cloud
In a series of posts we’ll explore ways to combine graph layout algorithms for various purposes, such as improving layout speed or achieving specific layout constraints.
In this topic we’ll show how to create a tag cloud using FractalLayout and SpringLayout algorithms from MindFusion diagramming API. You can download the complete project here:
The sample code will show several features of the Diagram control:
- FractalLayout
- SpringLayout
- custom node placement
- text-only nodes
We assume words frequencies are already counted and listed as “word: frequency” entries in a sorted file. The example uses tags extracted from the contents of Wikipedia’s Tag cloud page. Let’s start by parsing the file and creating a node for each word. We’ll assign the word frequency to the Weight property of nodes for future reference. Weight is also used by some layout algorithms (such as TreeMapLayout for creating tree maps) that could visually represent word frequencies as well:
RectangleF defaultBounds = new RectangleF(0, 0, 10, 20);
ShapeNode root;

private void MainForm_Load(object sender, EventArgs e)
{
	// read the tags file
	var reader = new StreamReader("words.txt");
	string line;
	while ((line = reader.ReadLine()) != null)
	{
		// each line contains "word: frequency" entries
		var parts = line.Split(new[] { ':' });
		var word = parts[0];
		var frequency = int.Parse(parts[1]);

		// create a diagram node for each word in the file
		var node = diagram.Factory.CreateShapeNode(defaultBounds);
		node.Weight = frequency;
		node.Text = word;

		// set font size corresponding to frequency
		node.Font = new Font(
			"Arial",
			8 + (float)Math.Log(node.Weight, 1.15),
			GraphicsUnit.Point);

		// resize the node to fit text
		var size = TextRenderer.MeasureText(node.Text, node.Font);
		node.Resize(
			2 + (float)MeasureUnit.Pixel.Convert(size.Width, diagram.MeasureUnit, null),
			2 + (float)MeasureUnit.Pixel.Convert(size.Height, diagram.MeasureUnit, null));

		// show only text, hide geometry
		node.Transparent = true;
	}
}
Next, let’s build a tree that will distribute largest nodes roughly uniformly when arranged by FractalLayout, where larger parent nodes are circled by their smaller child nodes:
while ((line = reader.ReadLine()) != null)
{
	// ...
	if (diagram.Nodes.Count == 1)
	{
		// save reference to the first node
		root = node;
	}
	else
	{
		// build a tree where each node has up to six children
		diagram.Factory.CreateDiagramLink(
			diagram.Nodes[diagram.Nodes.Count / 6],
			node);
	}
}

// use FractalLayout for initial placement. if the file entries are sorted, each circular
// branch will contain larger parent node centered between its smaller children
new FractalLayout().Arrange(diagram);
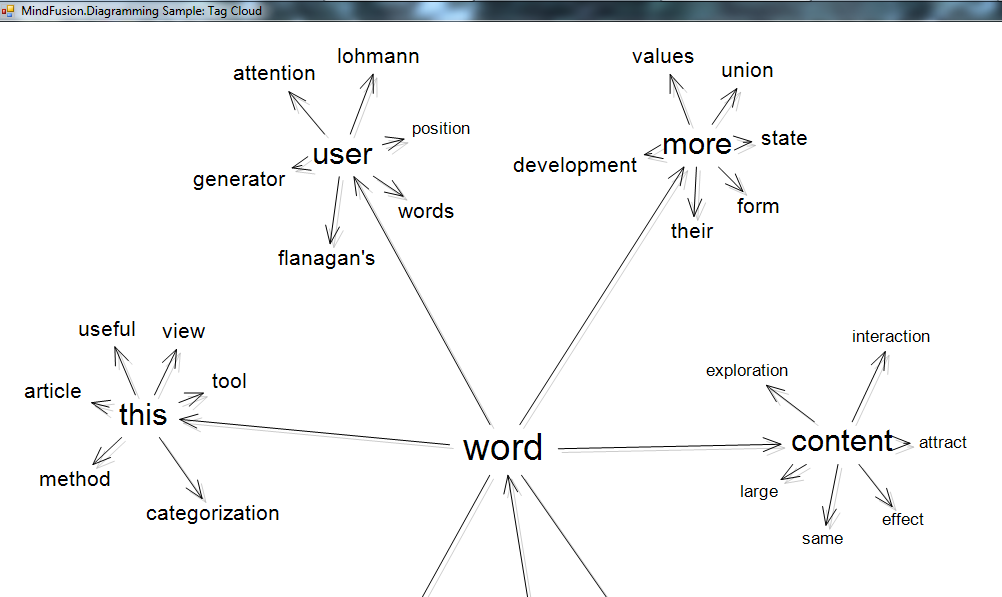
If you run the application now, you should see the following layout:
FractalLayout allocates some space for links, and we’ll reclaim it by deleting the links and compressing the initial layout of nodes:
// remove the links
while (diagram.Links.Count > 0)
	diagram.Links.RemoveAt(diagram.Links.Count - 1);

// pull all nodes towards the root to eliminate empty space that was occupied by links
var center = root.GetCenter();
foreach (var node in diagram.Nodes.Where(n => n != root))
{
	var relativePos = new Vector(center, node.GetCenter());
	var newPos = center + relativePos / 10;
	node.Move(
		newPos.X - node.Bounds.Width / 2,
		newPos.Y - node.Bounds.Height / 2);
}
Now apply SpringLayout to make distances between closely placed nodes more uniform, running only a few iterations to complete faster:
// run SpringLayout to distribute nodes more uniformly
var sl = new SpringLayout();
sl.Randomize = false;
sl.SplitGraph = false;
sl.NodeDistance = 3;
sl.IterationCount = 40;
sl.Arrange(diagram);
Run the following method to remove any overlaps remaining after SpringLayout. RemoveOverlaps works by starting from specified node and offsetting any nodes that overlap it, continuing by spiraling away while processing other nodes. This method could also be useful in an interactive application if you want to disperse overlapping nodes introduced by the user when they move a node:
void RemoveOverlaps(DiagramNode modifiedNode, float minDist)
{
	var queue = new Queue();
	queue.Enqueue(modifiedNode);

	while (queue.Count > 0)
	{
		var node = queue.Dequeue();
		var nodeCenter = node.GetCenter();
		var overlaps = FindOverlaps(node, minDist);
		foreach (var overlap in overlaps)
		{
			var ovrCenter = overlap.GetCenter();
			var ovrBounds = overlap.Bounds;
			var dx = ovrCenter.X - nodeCenter.X;
			var dy = ovrCenter.Y - nodeCenter.Y;
			if (Math.Abs(dx) > Math.Abs(dy))
			{
				// offset horizontally
				if (dx < 0)
					ovrBounds.X = node.Bounds.Left - ovrBounds.Width - minDist;
				else
					ovrBounds.X = node.Bounds.Right + minDist;
			}
			else
			{
				// offset vertically
				if (dy < 0)
					ovrBounds.Y = node.Bounds.Top - ovrBounds.Height - minDist;
				else
					ovrBounds.Y = node.Bounds.Bottom + minDist;
			}

			// shifting the node might introduce new overlaps, continue processing
			overlap.Bounds = ovrBounds;
			queue.Enqueue(overlap);
		}
	}
}

List FindOverlaps(DiagramNode modifiedNode, float minDist)
{
	var bounds = modifiedNode.Bounds;
	bounds.Inflate(minDist - 1, minDist - 1);

	var overlaps = new List();
	foreach (var node in diagram.Nodes)
	{
		if (modifiedNode == node)
			continue;
		if (bounds.IntersectsWith(node.Bounds))
			overlaps.Add(node);
	}
	return overlaps;
}
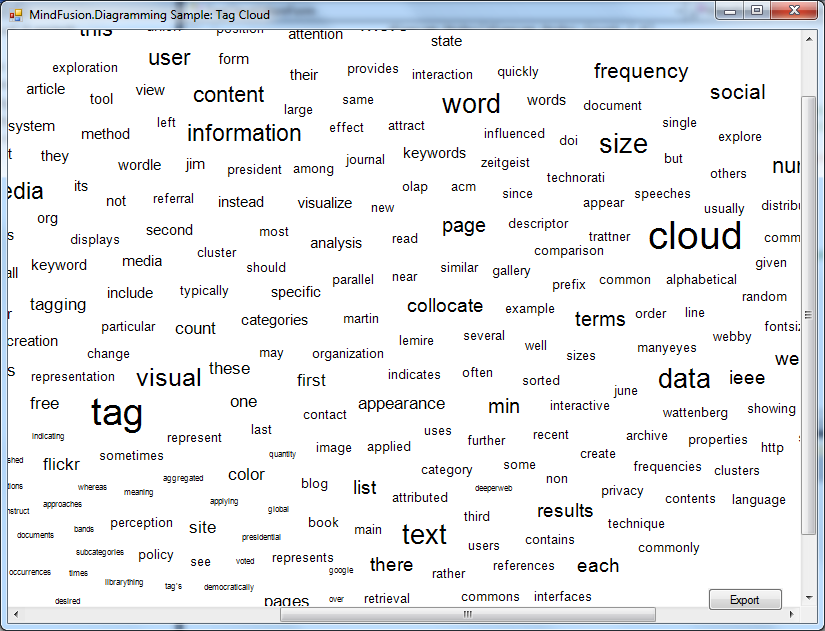
Finally run a few more iterations of SpringLayout to equalize distances again and zoom the diagram to show the whole tag cloud:
// remove any remaining overlaps
RemoveOverlaps(root, 0.1f);
sl.Arrange(diagram);

// show everything inside view
diagram.ResizeToFitItems(5);
diagramView.ZoomToFit();
If you run the application now, you should see the following image:
The code above uses MindFusion’s .NET API and can be used with Windows Forms, WPF, Silverlight and ASP.NET diagramming components. The Java API for Android and desktop Swing application will look similar, with setter method calls instead of property assignments.
You can download the trial version of any MindFusion.Diagramming component from this page.
Enjoy!