In this blog post we’ll build a database diagram reading the metadata of the sample MySQL database sakila.
Click here to watch the video that goes with these tutorials.
I. Configuration
For our sample to work we need to add the JDiagram.jar package to the project and a JDBC driver for MySQL. We download the JDBC driver from https://dev.mysql.com/downloads/connector/j/ and we add mysql-connector-java-5.1.40.jar to the libs folder of our project where we have placed JDiagram.jar.
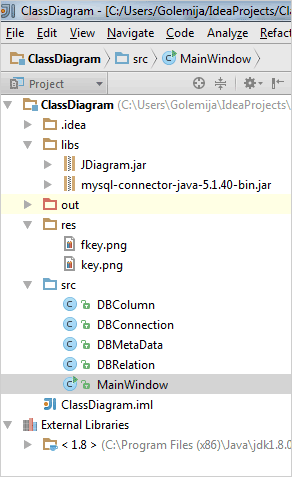
The structure of the Class Diagram Java project.
II. Helper Classes
We create several helper classes that will handle the connection to the database and re-creation of the database metadata in a format which we can use to build the DB diagram.
1. We have created two classes for connecting to the sakila MySql database and reading the metadata. For the tables. In general we are interested in the names of the tables, the columns in them with column name, column data type and column data size. We also want the relationships in the database, with the primary and foreign keys. The classes that provide us with this information are DBConnection, which binds to the database and DBMetaData, which reads the database with the help of the DatabaseMetaData and ResultSet classes of the Java platform.
2. For the purpose of our project we have created two more classes. The first one represents a column in the database – DBColumn. It has just a few fields:
public class DBColumn {

    public String name;
    public String type;
    public String size;
    public boolean primaryKey;
The other class describes a relation in the database. It is equally simple:
public class DBRelation {

    public String pk_key;
    public String pk_table;

    public String fk_key;
    public String fk_table;
3. We have defined an ArrayList tables variable for the table names. We call the respective method of the DBMetaData class that reads the table names and populates the tables list.
III. UI Controls
We will use an instance of the Diagram class, a DiagramView control, a JScrollPane and a zoom control. What we want to show is a diagram pane that is scrollable both horizontally and vertically and a zoom control next to it.
We create the diagram and make sure it will resize itself when needed:
//diagram initialization
diagram = new Diagram();
diagram.setAutoResize(AutoResize.RightAndDown);
The diagram needs a diagramView to render itself onto. We create one and add it to a JScrollPane. The scroll pane provides the necessary scrollbars if the flowchart gets too big.
//initialize a diagramView that will render the diagram.
diagramView = new DiagramView(diagram);
diagramView.setVisible(true);

//use a scroll pane to host large diagrams
_scrollPane = new JScrollPane(diagramView);
_scrollPane.setVisible(true);
_scrollPane.setAutoscrolls(true);
The Java Diagram library provides a handful of auxiliary controls and in our sample we’ll use the Zoom control:
//provide a zoomer for the diagram
zoomer = new ZoomControl();
zoomer.setView(diagramView);
zoomer.setPreferredSize(new Dimension(70, 50));
zoomer.setVisible(true);
We use the setView() method to associate the zoom control with the diagramView. The BorderLayout algorithm helps us arrange the controls. First, we apply it on the JFrame ContentPane and then we align the zoom control to the right. Finally, we add the JScrollPane to the center, which lets it use all the available space left by the zoomer:
getContentPane().setLayout(new BorderLayout());
this.add(zoomer, BorderLayout.EAST);
this.add(_scrollPane, BorderLayout.CENTER);
IV. Creating the Tables
We first read the data for the DB columns and then for each table in the database we create a diagram TableNode.
ArrayList tableData = DBMetaData.getColumnsMetadata(tableName);
We use the Factory class of the diagram library:
Dimension tableSize = new Dimension(50, 30);
TableNode _table = diagram.getFactory().createTableNode(10, 10, 50, tableData.size() * 8, 4, tableData.size());
_table.setCaption("" + tableName + "");
_table.setId(tableName);
The createTableNode() method that we use takes as arguments the location of the table node, its width and height and the count of rows and columns. We use HTML formatting to make the caption of the table bold. For caption and for id of the tableNode we use the name of the table.
Since we need to use HTML styling on text in the diagram nodes we must specify:
diagram.setEnableStyledText(true);
Let’s add some more customization on the table nodes:
_table.setCaptionFormat(new TextFormat(Align.Center, Align.Center));
_table.setCaptionHeight(7f);
_table.setAllowResizeColumns(true);
_table.setShape(SimpleShape.RoundedRectangle);
_table.setBrush(new SolidBrush(new Color((int)204, (int)224, (int)255)));
The caption is aligned in the center and we increase slightly the default caption height. Then we allow users to resize table columns with the mouse and we change the table shape from rectangle to a rectangle with rounded edges. Finally, we color the table nodes with a light blue brush.
Note that once Factory creates a node it gets added to the DiagramNodes collection of the control automatically.
Now let’s populate the table with data:
int rowIndex = 0;

for(DBColumn column: tableData)
{
    _table.getCell(1, rowIndex).setText("" + column.name + "");
    _table.getCell(2, rowIndex).setText(column.type);
    _table.getCell(3, rowIndex).setText(column.size);

    //if the column is a primary key - set an image. If not, leave it empty.
    if(column.isPrimaryKey())
    {
        try {

            File pathToFile = new File("res/key.png");
            Image image = ImageIO.read(pathToFile);
            _table.getCell(0,rowIndex).setImage(image);


        } catch (IOException ex) {
            ex.printStackTrace();
        }
    }

    rowIndex++;

}
Here we cycle through all DBColumn objects that we have created using the database metadata. In each row in the table node we write the name of the database field, the data type and the data size. Note that we start with the second column (index 1) because the first one is reserved for an image of the primary or foreign key, if applicable. So far we have gathered information only for the primary key.
Since we want the image to occupy the first column we must make some adjustments to the TableNode and its size:
//adjust the size of the tables and columns.
_table.resizeToFitText(true);
Rectangle2D.Float t_size = _table.getBounds();
_table.getColumns().get(0).setWidth(7);
_table.resize(t_size.width + 7, t_size.height);
_table.resizeToFitImage();
First we use resizeToFitText to make the table auto calculate the size it needs based on the text it holds. This, unfortunately would not include space for the image, so we must correct it manually. We resize the first column with 7 pixels to allow the image to fit and we increase the size of the table as well. Then we call resizeToFitImage() to let the TableNode update its new size.
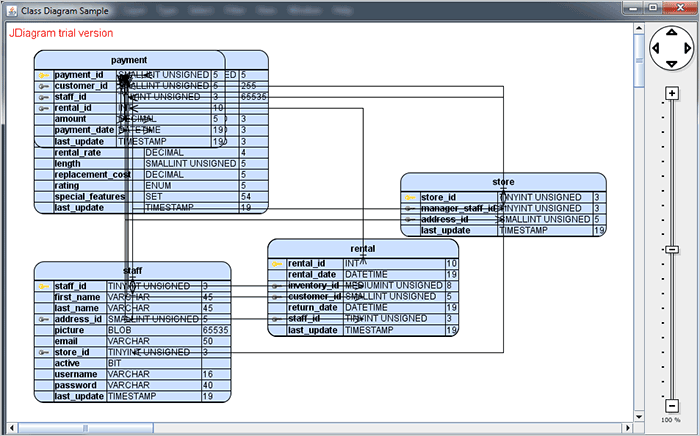
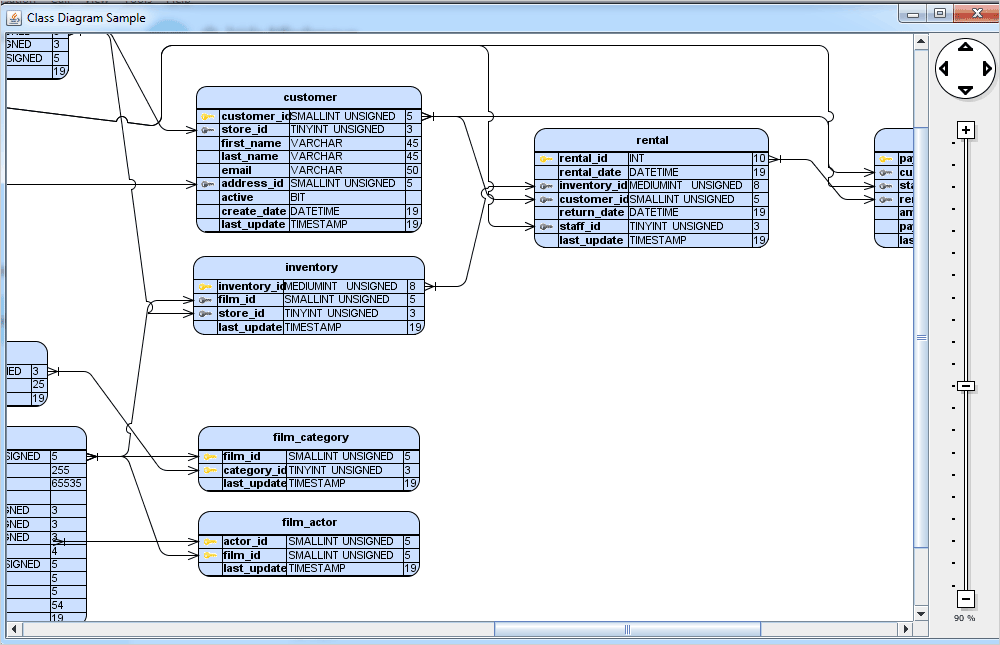
With that we finish the first part of our tutorial. Part II will walk you through the steps to create the relationships among the nodes and arrange the database diagram using the automatic layout algorithms provided with the Java Diagram library. Here is our diagram so far:
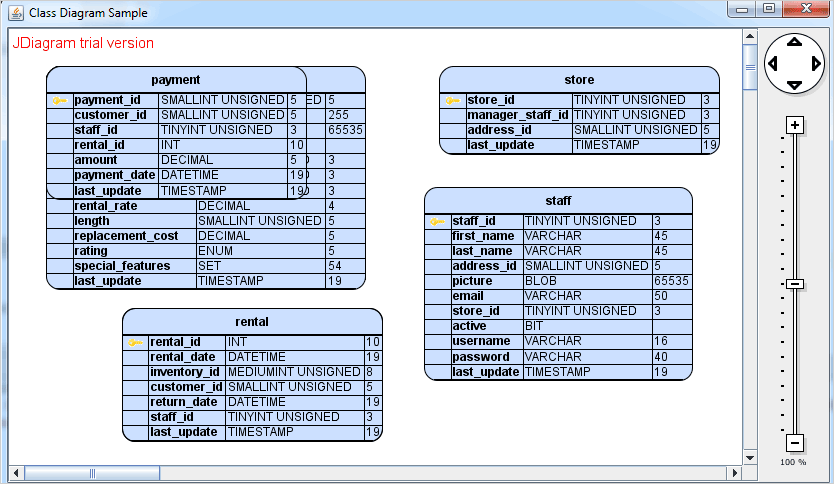
Java Database Schema: Tables
You can download the complete sample from this link. The sample contains the sakila MySQL database with a PDF file with instructions how to install it if you haven’t already. You will need to have an installed and running MySQL server. Remember to change the login data in the DBConnection.java file to match your login credentials.
The second part of this tutorial is here.
About Diagramming for Java Swing: MindFusion.Diagramming for Java Swing provides your Java application with all necessary functionality to create and customize a diagram. The library is very easy to integrate and program. There are numerous utility methods, rich event set, more than 100 predefined shapes. The tool supports a variety of ways to render or export the diagram, advanced node types like TreeView nodes, hierarchical nodes, tables, container nodes and many more. There are 15 automatic layouts, various input / output options and fully customizable appearance. A detailed list with JDiagram’s features is uploaded here. You can check the online demo to see some of the functionality implemented.
Diagramming for Java Swing is royalty free, there are no distribution fees. Licenses depend on the count of developers using the tool – check here the prices.