In this post you’ll learn how to create a beautiful organization chart where most of the work is done by the ASP.NET flowchart control. We’ll use the capabilities of the control to create nodes, where we’ll put an image and formatted text. We’ll create automatically links among the nodes and apply the tree layout algorithm to arrange the diagram. Let’s start.
I. Add the Necessary DLLs.
Create a new blank ASP.NET project and add those of the dll-s of the control that we need for this project:
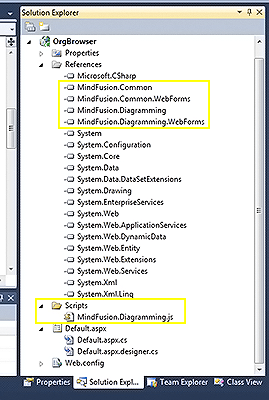
ASP.NET Diagram dll-s needed to build the the org chart
MindFusion.Diagramming, MindFusion.Diagramming.WebForms, MindFusion.Common, MindFusion.Common.WebForms. The asp.net diagram control needs the MindFusion.Diagramming.js file to render its contents. If you add it directly into the project’s folder you won’t have to add a reference to it. Since we create a ew project folder “Scripts” where we put it, we’ll have to reference it in code. We’ll talk about this in the next step.
II. Setup of the Diagram Control.
We add a new WebForm file to the project and into the HTML code we register the diagramming dll with the tag “ndiag”.
<%@ Register Assembly="MindFusion.Diagramming.WebForms" Namespace="MindFusion.Diagramming.WebForms" TagPrefix="ndiag" %>
We need a reference to a few *.js and *.css files as shown below:
<link href="common/jquery-ui.min.css" rel\="stylesheet">
<link href="common/samples.css" rel="stylesheet">
<script type="text/javascript" src="common/jquery.min.js"></script>
<script type="text/javascript" src="common/jquery-ui.min.js"></script>
<script type="text/javascript" src="common/samples.js">
The *.js files are located in a folder “common” in the project. Of course, you can reference them from their respective online locations.
Don’t forget the ScriptManager:
<asp:scriptmanager id="ScriptManager1" runat="server">

</asp:scriptmanager>
Now it’s time for the diagram – we add it in the HTML of the page using the “ndiag” tag that we’ve defined above.
<ndiag:diagramview id="fc" runat="server" clientsidemode="Canvas" style="position: absolute; left: 0px; top: 0px; right: 0px; bottom: 0px;" jslibrarylocation="Scripts/MindFusion.Diagramming.js" treeexpandedscript="onTreeExpanded">
      <diagram autoresize="RightAndDown" defaultshape="Rectangle" shapehandlesstyle="DashFrame">
</diagram></ndiag:diagramview>
The Diagram is in a DiagramView control that will render it contents. Node the “JsLibraryLocation” attribute – we use it to point to the location of the Diagramming.js file which we’ve placed in the Scripts folder in step 1.
III. Building the Diagram
We get the diagram object that we’ve defined in HTML like that:
Diagram diagram = fc.Diagram;
The data for the org chart is located in a XML file. The structure is something like this:
<employee>
  <name>Martin Larovsky</name>
  <photourl>http://mindfusion.eu/_samples/ASP.NET_OrgChart/martin-larovsky.png</photourl>
  <title>COO</title>
  <level>Executive</level>
  <date>Aug 2015</date>
    <employee>
      <name>Tanja Orsy</name>
..........................................

</employee></employee>
Each new hierarchy level is a list of Employee tags contained within the upper Employee node.
The first node is the top of the tree and we read it separately. First we open the XML document and then we get the first employee:
XmlDocument xmlDoc = new XmlDocument();
xmlDoc.Load("http://mindfusion.eu/_samples/ASP.NET_OrgChart/employees.xml");
XmlNode ceo = xmlDoc.SelectSingleNode("Employee");
We use the methods of the diagram control to create a new shape node and assign its properties to the data that we’ve read from the XML file:
ShapeNode root = diagram.Factory.CreateShapeNode(nodeBounds);
root.Text = "" + ceo["Name"].InnerText + " (" + ceo["Title"].InnerText + ") since " +
ceo["Date"].InnerText + "";
root.Shape = Shape.FromId("RoundRect");
root.TextPadding = new Thickness(0, 0, 3, 0);
root.Brush = new MindFusion.Drawing.SolidBrush(Color.FromArgb(121, 109, 173));
root.TextFormat.Alignment = StringAlignment.Far;
root.EnableStyledText = true;
root.ImageUrl = ceo["PhotoUrl"].InnerText;
root.ImageAlign = MindFusion.Drawing.ImageAlign.MiddleLeft;
The Factory class enables us to create different nodes within given bounds. HTML formatting of the text is supported because we have turned on the EnableStyledText property. The node shape is rounded rectangle for aesthetic reasons. The texi is aligned to the right and the image – to the left of the node. We use the ImageUrl property because the image is uploaded online and we just tell the ShapeNode from where to read it.
The nodes are read and created in a method that uses recurrence to cycle through all of them – you can see it in the sample. It has one line that’s worth noting:
//cycles through all nodes using recurrence and creates a DiagramNode for all employees
private void CreateChildren(Diagram diagram, DiagramNode parentDiagNode, XmlNode parentXmlNode)
{
foreach (XmlElement element in parentXmlNode.SelectNodes("Employee"))
{
.................................................................
diagram.Factory.CreateDiagramLink(parentDiagNode, node);
Note how we instruct the Factory to create a link between each node and its parent. This way we have the diagram ready.
IV. The Layout
If you run the application you’ll see just one node. It’s actually a pile of nodes. We need to arrange it but luckily the ASP.NET Diagram control has an impressive selection of layout algorithms. In our case the Tree layout is the perfect choice:
TreeLayout layout = new TreeLayout();
layout.Type = TreeLayoutType.Cascading;
layout.Direction = TreeLayoutDirections.LeftToRight;
layout.LinkStyle = TreeLayoutLinkType.Cascading2;
layout.NodeDistance = 3;
layout.LevelDistance = -8; // let horizontal positions overlap
layout.Arrange(diagram);
The TreeLayout class has plenty of customization options, here we have selected those that would make an org chart look best. You can experiment with the full set of options and see what looks right in your particular scenario.
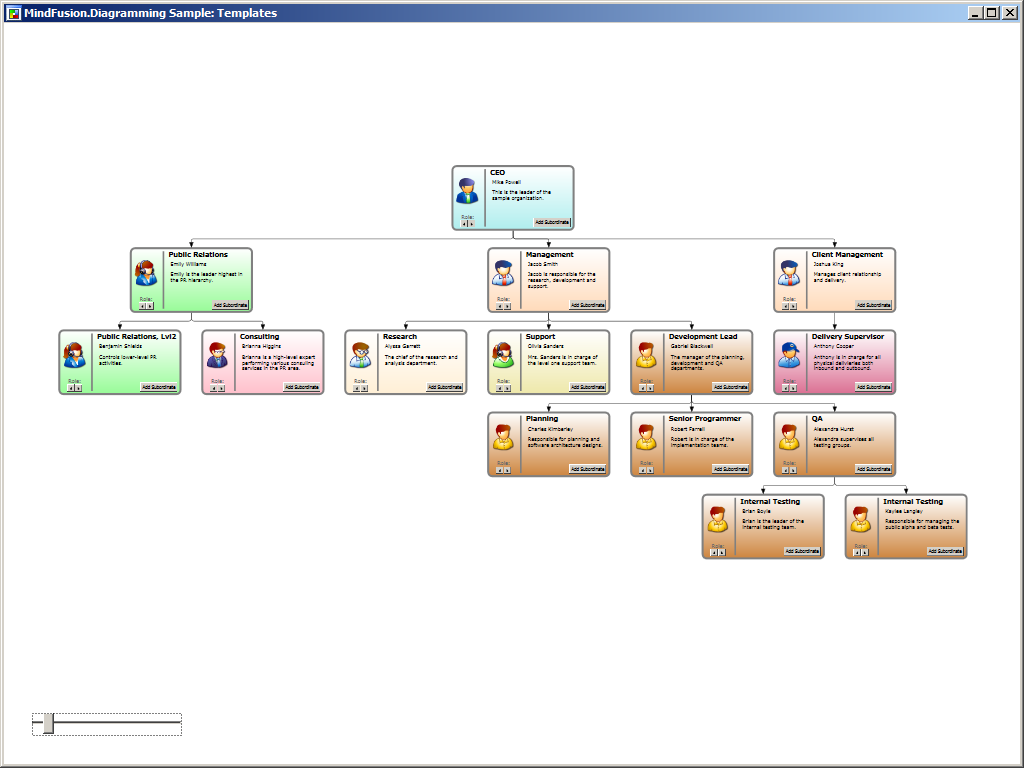
Here is the final result:
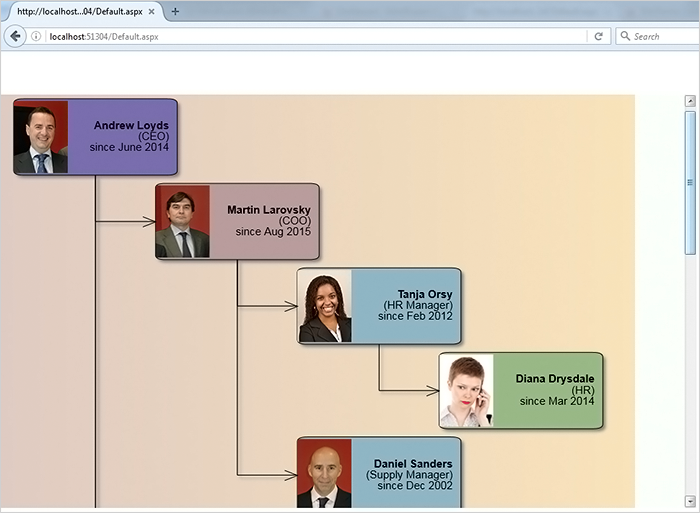
ASP.NET Org Chart
The source code of the project together with all necessary libraries and scripts can be downloaded from here:
Download ASP.NET Organization Browser Sample
You are welcome to ask any questions about the ASP.NET Diagram control at MindFusion discussion board or per e-mail at support@mindfusion.eu.
Click here to visit the official page of MindFusion ASP.NET Diagram Control.
We hope you find this tutorial useful and thank you for your interest in MindFusion developer tools.