MindFusion.Diagramming for JavaScript is now also available as a Node.js module, and you can use the diagram API you know and love in server code 🙂 A sample server application and the module script are available here:
For example, you can submit to server a diagram drawn interactively by the user and examine its contents there by iterating over the nodes and links members of the Diagram class:
// on client side
$.ajax(
{
	type: "post",
	url: "http://localhost:1234/diagram",
	contentType: "application/json",
	data: diagram.toJson(),
	success: function(data)
	{
		console.log('success');
	},
	error: function(jqXHR, textStatus, err)
	{
		console.log(err);
	}
});

// on server side
app.post('/diagram', function(req, res)
{
    // won't be required in final release
    var dummyCanvas = { parentNode:{} };

    // create Diagram instance
    var diagram = new Diagram(dummyCanvas);

    // load diagram elements drawn by user
    diagram.fromJson(req.rawBody);

    // examine diagram contents
    console.log(diagram.nodes.length + " nodes");
    console.log(diagram.links.length + " links");
    diagram.nodes.forEach(function (node, index)
    {
        console.log("node " + index + ": " + node.getText());
    });

    // send some response
    res.send('ok');
});
Or you could build the diagram on server side and send it to the browser to render in client-side Diagram control:
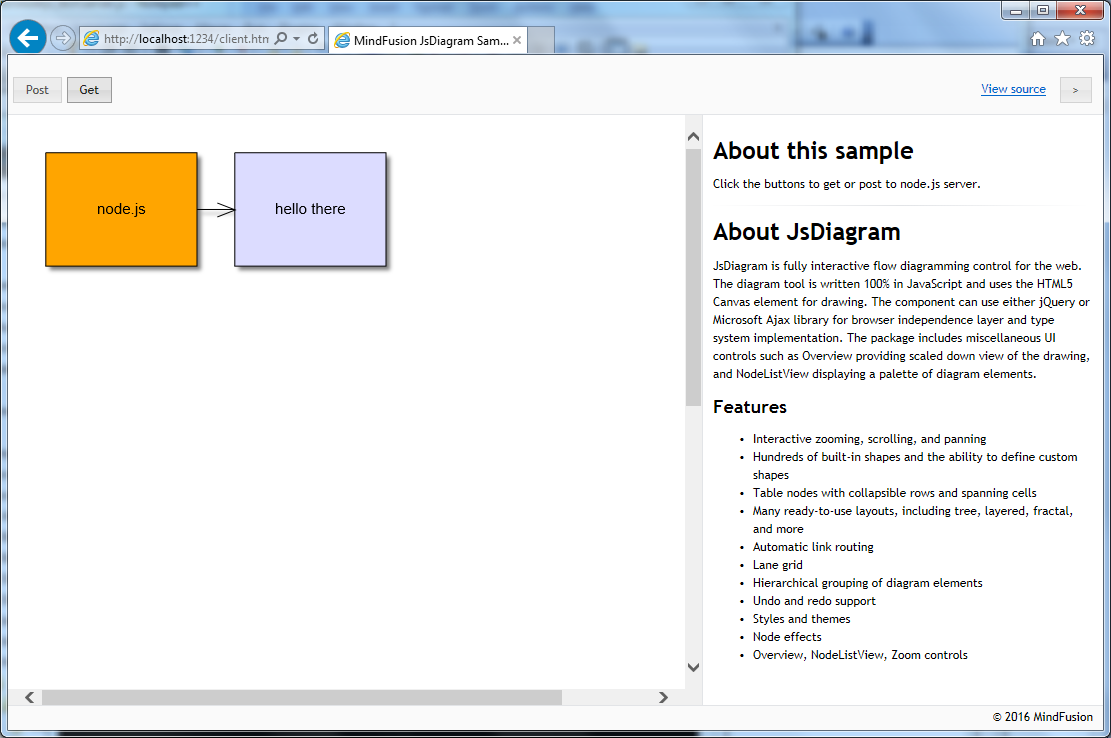
// on server side
app.get('/diagram', function(req, res)
{
    // won't be required in final release
    var dummyCanvas = { parentNode:{} };

    // create Diagram instance
    var diagram = new Diagram(dummyCanvas);

    // create some diagram items
    var node1 = diagram.getFactory().createShapeNode(10, 10, 40, 30);
    var node2 = diagram.getFactory().createShapeNode(60, 10, 40, 30);
    var link = diagram.getFactory().createDiagramLink(node1, node2);

    // set nodes' content
    node1.setText("node.js");
    node1.setBrush("orange");
    node2.setText("hello there");

    // send diagram json
    res.send(
        diagram.toJson());
});

// on client side
$.ajax(
{
	type: "get",
	url: "http://localhost:1234/diagram",
	success: function(data)
	{
		diagram.fromJson(data);
	},
	error: function(jqXHR, textStatus, err)
	{
		console.log(err);
	}
});
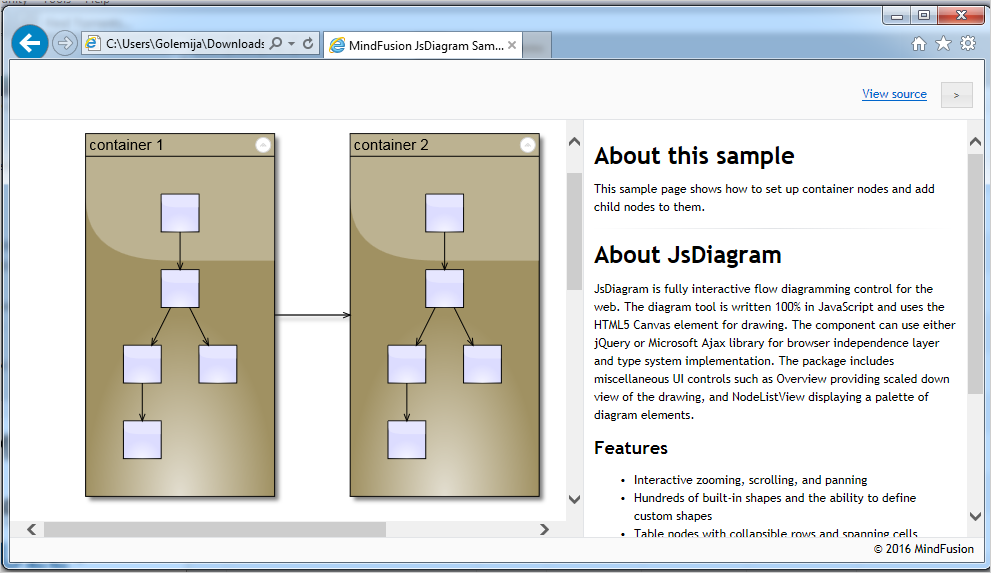
To run the sample Node.js application, run “node server.js” from command line and open http://localhost:1234/client.html in your browser. Draw some nodes and links, edit their text and click Post to see them enumerated in Node’s console. Clicking the Get button will show this diagram built on server side:
For more information on MindFusion’s JavaScript Diagram API, see MindFusion.Diagramming online help
Enjoy!