Diagramming for WPF, V3.3 Released

We are pleased to announce the new release of our WPF flowchart control. Here is an overview of the new features:

Support for Visio stencils
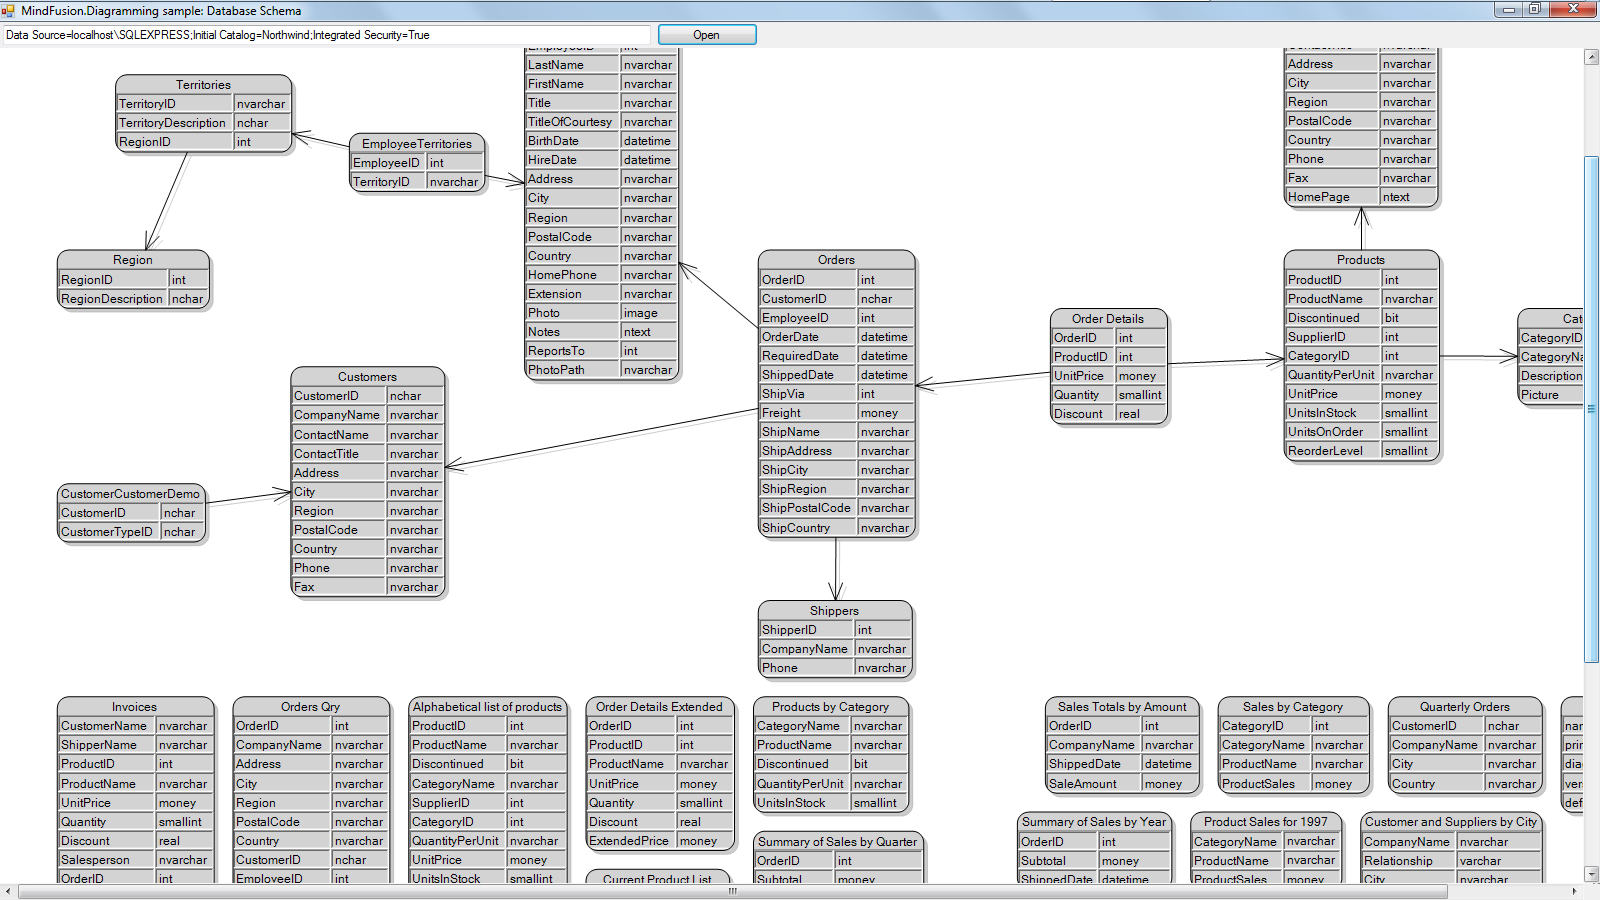
Your WPF application can now render shapes from stencil files in Visio 2003 XML stencil format (.vsx). You must use an instance of the VisioStencil class to load a stencil file. The Visio shapes are reproduced in the diagram control through VisioNode objects. To associate a Visio stencil shape with the flowchart node, create an instance of the VisioContent class and assign it to the node’s Content property.min

Visio Stencil Shapes

Diagram for WPF Control: Visio Stencil Shapes

Note: The standard shape stencils installed with Visio are copyrighted by Microsoft, and you should not use them in your diagram application. This feature is intended to let you use public domain diagram node stencils, or commercial clipart you have purchased a license for.

License keys
We no longer prepare a separate trial built of the assemblies of the flowchart control. Instead, set the Diagram.LicenseKey property to disable the component’s evaluation mode and stop displaying trial messages. If your WPF application contains more than one Diagram instance or other controls by MindFusion, you could call MindFusion.Licensing.LicenseManager.AddLicense(key) from application start-up code to specify the key once instead of setting it per each control. License key strings are now listed on the Keys & Downloads page at MindFusion’s customer portal.

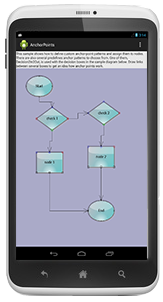
AnchorPatern improvements

  • The XUnit and YUnit properties allow specifying the coordinates of an AnchorPoint as a fixed offset from the node’s top-left corner rather than in percentage, so that the point position does not change when the node is resized.
  • The AnchorPattern property of the Shape class lets you associate anchor points with shape definitions. If a ShapeNode instance does not contain its own AnchorPattern, it will derive the one defined by the node’s Shape.
  • TableNode.RowAnchorPattern property lets you specify default AnchorPattern for all table rows.
Diagram Node anchors.

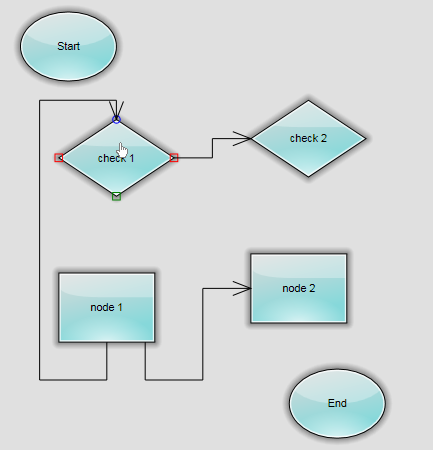
MindFusion WPF Flowchart Library: anchor points for diagram nodes

You can download the trial version of the software from this link:

Download MindFusion.Diagramming for WPF 3.3

The download contains all runtime libraries of the control, various samples for different .NET versions, extensive desktop documentation and step-by-step tutorials.

If you face difficulties installing or using Diagramming for Wpf, please contact MindFusion support team per e-mail or phone. You can also use the forum or help desk. Most support inquiries are answered within hours of receiving them.

About MindFusion.Diagramming for Wpf: Designed and developed to be easy to integrate, use, and customize, this native WPF flowchart component places at your disposal every single feature you would ever need to create diagrams, graphs, schemes, org charts, DB relationships, genealogy trees, class hierarchies and many more. Its long list of style options gives you complete control over the appearance of the diagram. With a set of eight automatic layouts you are sure to find the arrangement that suits perfectly your WPF application.

The diagram control boasts a long list of events, properties and methods for user interaction, item creation,
data input and output. You can read the full features list here. The online demo shows samples that demonstrate various capabilities of the control. The licensing scheme and prices are uploaded at the buy page. Source code is also available.

Diagramming for Android, V1.2

We are happy to announce the new version of MindFusion.Diagramming library for Android. We have added the following new features and improvements:

AnchorPattern improvements

  • The XUnit and YUnit properties allow specifying the coordinates of an AnchorPoint as a fixed offset from the node’s top-left corner rather than in percentage, so that the point position does not change when the node is resized.
  • The AnchorPattern property of Shape class lets you associate anchor points with shape definitions. If a ShapeNode instance does not contain its own AnchorPattern, it will derive the one defined by the node’s Shape.
Android diagramming library: anchor points

Android diagramming library: anchor points

Miscellaneous

  • Links can now snap to nodes from a distance when their AutoSnapToNode property is enabled. The maximum snap distance is specified via Diagram.AutoSnapDistance property. AutoSnapToNode supersedes the old SnapToNodeBorder property, which worked only for nodes under pointer location.
  • Type of Margin property of LinkLabel has been changed from float to Thickness.
  • The changeUnit method sets a new MeasureUnit and scales the coordinates of diagram items to keep them the same size.
  • Fixed node spacing in bottom-to-top TreeLayout.
  • Multiple-resize of rotated nodes fixed to apply same offsets in nodes’ local coordinate system.
  • Fixed text layout in rotated nodes.
  • Improved layout of text components in CompositeNode.

The new version is available for download from the following link:

Download Diagramming for Android, V1.2

If you require technical support, please use the forum or write us at support@mindfusion.eu. A help desk is also available. Providing fast and competent technical support is among the priorities of MindFusion. We answer most support inquiries within hours of receiving them.

About Diagramming for Android: A native Java class library, which provides your Android application with a powerful set of features for creating, customizing and displaying flowcharts, genealogy trees, class hierarchies, networks, algorithms and much more. The component offers a rich choice of predefined shapes, many pen and brush options as well HTML-like formatting of text. Diagram nodes can hold text as well images, can be semi-transparent and support glass reflection effects. The component offers various automatic layout algorithms and a rich user interaction model, which supports zoom, scroll, alignment guides and more. You can read the features list of MindFusion Diagramming library for Android here. For pricing and licenses check this link.

Diagramming for WinForms, V6.3.2

We have released a new version of the popular FlowChart.NET diagramming component. Here is an overview of the newly added features:

Support for Microsoft Visio stencils

You can now display shapes from stencil files in Visio 2003 XML stencil format (.vsx) into your FlowChart.NET diagrams. To load a stencil file, use an instance of the VisioStencil class. The shapes are displayed in the diagram through VisioNode objects. It’s very easy to associate a stencil shape with the node – just create an instance of the VisioContent class and assign it to the node’s Content property.

Note: Standard stencils installed with Visio are copyrighted by Microsoft, and you should not use them in your application. This feature is intended to let you use public domain stencils, or commercial clipart you have purchased a license for.

Diagramming for WinForms Visio import and export classes do not support VisioNodes yet; this will be implemented in future releases.

Visio Stencil Shapes

Visio Stencil Shapes

License keys

MindFusion no longer supports separate trial and licensed builds of the control assemblies. Instead, set the DiagramView.LicenseKey property to disable the component’s evaluation mode and stop displaying trial messages. If your application contains more than one DiagramView instance or other MindFusion components, you could call MindFusion.Licensing.LicenseManager.AddLicense(key) from application start-up code to specify the key once instead of setting it per each control. License key strings are now listed on the Keys & Downloads page at MindFusion’s customer portal.

Miscellaneous

  • You can specify the maximum tab size in TabbedDiagramView with the new MaxTabSize property.
  • The type of LinkLabel.Margin property has been changed from float to Thickness.
  • Initial state of PrintPreviewEx landscape button now corresponds to value of PageSettings.Landscape property.
  • ChangeUnit now also scales child elements of nodes such as TableNode cells and TreeViewNode items.
  • as well other new features and improvements. Read the full list here.

The trial version is available for direct download from the link below:

Diagramming for WinForms, V6.3.2 Trial Version Download

Your comments and feedback about the new version is welcomed. You can use the Diagramming for WinForms forum, the help desk or write us at support@mindfusion.eu. Our support team will be pleased to help you.

About MindFusion.Diagramming for WinForms: A programming component that provides any WinForms application with a full set of features for creating and customizing all types of diagrams, flowcharts, schemes, hierarchies, trees, graphs etc. The control provides numerous ways to save and load a diagram, six auxiliary controls and more than 12 automatic graph layout algorithms. Diagram elements include scrollable tables, container nodes, multi-segment arrows, custom diagram item types and many more. Further details here.

Diagramming for WinForms is a royalty-free component, clients get 12 month upgrade subscription when buying a license. The source code is also available for purchase. Visit the buy page for a list with the current license prices.

Creating a proprietary invoice editor

In this post we will show how to create an invoice editing application (using MindFusion.Reporting) for the end users of an organization. The source code of the sample is available for download from here:

https://mindfusion.eu/_samples/ReportingInvoiceEditor.zip

Introduction
We start off by creating a new Windows Forms Application in Visual Studio 2010 or later. Change the target framework of the application to “.NET Framework 4” (or later). The ReportEditor component that will be used as an in-place invoice editor requires at least .NET 4.

Add the ReportEditor component to the main form, set its Dock to Fill.

The invoice template
The invoice template displayed by the application is stored in an XML file. The original template is created beforehand and is located in Invoice.xml. All modifications to the template done by the end users will be stored back to the XML file upon exiting the application. Add the following line to the main form’s constructor to load the invoice template when the main form is constructed:

reportEditor1.OpenReport(@"Invoice.xml");

Adding the data source
From the “Data -> Add New Data Source…” menu in Visual Studio create a new data source from the nwind.mdb database. Select the Orders table and the Invoices query in the Data Source Configuration Wizard. In the XML Schema (nwindDataSet.xsd) ensure that there is a relation between the Orders and Invoices table adapters. The relation should link the OrderID fields of the two tables and should be named “Orders_Invoices”. Build the application so that Visual Studio creates the classes for the data set and the selected table adapters. Go back to the main form designer and add nwindDataSet, InvoicesTableAdapter, and OrdersTableAdapter components to the form. In the constructor of the form, add the following lines in order to fill the data set with the data from the source database:

invoicesTableAdapter1.Fill(nwindDataSet1.Invoices);
ordersTableAdapter1.Fill(nwindDataSet1.Orders);

In addition, we need to register the two tables as data sources in the report editor. This is essential because these data sources are used by the invoice report. It is also important that the data sources are registered before the report is initially loaded through the OpenReport method.

reportEditor1.AddDataSource(nwindDataSet1.Orders, "Orders");
reportEditor1.AddDataSource(nwindDataSet1.Invoices, "Invoices");

Saving the template
Override the OnClosing event of the form and add the following line to ensure that all changes to the invoice template are written back to the XML file:

reportEditor1.SaveReport(@"Invoice.xml");

Adding the menu
Create a menu strip for the application with the following structure:

  • File
    • Print
    • Print Preview
    • Exit
  • Edit
    • Undo
    • Redo

Add the following event handlers for the menu items:

private void printToolStripMenuItem_Click(object sender, EventArgs e)
{
	var printer = new ReportPrinter();
	printer.Report = reportEditor1.Report;
	printer.Report.Run();
	printer.Print();
}

private void printPreviewToolStripMenuItem_Click(object sender, EventArgs e)
{
	var printer = new ReportPrinter();
	printer.Report = reportEditor1.Report;
	printer.Report.Run();

	var preview = new PrintPreviewForm();
	preview.Document = printer;
	preview.ShowDialog();
}

private void exitToolStripMenuItem_Click(object sender, EventArgs e)
{
	Close();
}

private void undoToolStripMenuItem_Click(object sender, EventArgs e)
{
	reportEditor1.Undo();
}

private void redoToolStripMenuItem_Click(object sender, EventArgs e)
{
	reportEditor1.Redo();
}

The image below illustrates the running application:

reporting-invoiceeditor

The MindFusion.Reporting component can be downloaded from here:

https://www.mindfusion.eu/ReportingTrial.zip

Enjoy!

Database schema diagram

In this post we’ll show how to use TableNode objects to display tabular data, more specifically database schema information. A Visual Studio sample project containing the code from this post is available for download here:

DatabaseSchema.zip

To start, create a new Windows Forms application, and place a text field for connection string, a button and a DiagramView on the form. In the code-behind file, add following field to map table name to respective TableNode objects:

Dictionary<string, tablenode=""> tables = new Dictionary<string, tablenode="">();
</string,></string,>

Add a RectangleF that stores default size passed to CreateTableNode method:

RectangleF defaultSize = new RectangleF(0, 0, 30, 30);

Create a ReadTables method, which provided an SqlConnection, parses its schema information and creates diagram nodes:

void ReadTables(SqlConnection connection)
{
	// get table schema definitions from connection
	var schema = connection.GetSchema("Tables");
	foreach (DataRow row in schema.Rows)
	{
		// fetch table name
		var name = row["TABLE_NAME"].ToString();

		// create respective node
		var table = diagram.Factory.CreateTableNode(defaultSize);
		table.Caption = name;
		table.Shape = SimpleShape.RoundedRectangle;
		table.Brush = new MindFusion.Drawing.SolidBrush(Color.LightGray);

		// register node in dictionary for future foreign key reference
		tables[name.Replace(" ", "_")] = table;
		ReadFields(table, connection,
			row["TABLE_CATALOG"].ToString(), null, name);
	}

	ReadForeignKeys(connection);
}

The ReadFields method takes table node and name parameters and creates node cells that will show information for the column name and type of database tables:

void ReadFields(TableNode node,
	SqlConnection connection, string db, string owner, string tableName)
{
	// remove default cells
	node.RowCount = 0;

	// reserve one column for name and one for data type
	node.ColumnCount = 2;

	// read column definitions of specified table
	var schema = connection.GetSchema("Columns", new[] { db, owner, tableName });
	foreach (DataRow row in schema.Rows)
	{
		// add a new row to the node
		int r = node.AddRow();

		// set cells' text to the column name and type
		node[0, r].Text = row["COLUMN_NAME"].ToString();
		node[1, r].Text = row["DATA_TYPE"].ToString();

	}

	// make table cells big enough to show all text
	node.ResizeToFitText(false);
}

The ReadForeignKeys method creates DiagramLink connectors between table nodes to show the relationships between database tables:

void ReadForeignKeys(SqlConnection connection)
{
	var schema = connection.GetSchema("ForeignKeys");
	foreach (DataRow row in schema.Rows)
	{
		// read foreign key information
		string fkName = row["CONSTRAINT_NAME"].ToString();
		string tableName = row["TABLE_NAME"].ToString().Replace(" ", "_");
		string prefix = "FK_" + tableName + "_";
		if (fkName.StartsWith(prefix))
		{
			string targetName = fkName.Substring(prefix.Length);

			// get table nodes registered for specified names
			if (tables.ContainsKey(targetName) && tables.ContainsKey(tableName))
			{
				var table = tables[tableName];
				var targetTable = tables[targetName];

				// create a link between the nodes to show relationship
				diagram.Factory.CreateDiagramLink(table, targetTable);
			}
		}
	}
}

Finally handle the button’s click event to open specified connection and call ReadTables. Apply AnnealLayout to arrange the tables so that they do not overlap:

private void btnOpen_Click(object sender, System.EventArgs e)
{
	diagram.ClearAll();

	try
	{
		var connection = new SqlConnection(tbConnection.Text);
		connection.Open();

		// read schema and create corresponding diagram items
		ReadTables(connection);

		connection.Close();
	}
	catch (Exception exception)
	{
		MessageBox.Show(exception.Message);
		diagram.ClearAll();
	}

	// arrange the tables to remove overlaps
	var layout = new AnnealLayout();
	layout.SplitGraph = true;
	layout.Randomize = false;
	layout.MultipleGraphsPlacement = MultipleGraphsPlacement.MinimalArea;
	layout.Margins = new SizeF(10, 10);
	layout.Arrange(diagram);
}

If you run the project and open the Northwind sample database by Microsoft, you should see this diagram:

database schema layout

The code above uses MindFusion’s .NET API and can be used with Windows Forms, WPF, Silverlight and ASP.NET diagramming components. The Java API for Android and desktop Swing application will look similar, with setter method calls instead of property assignments.

You can download the trial version of any MindFusion.Diagramming component from this page.

Enjoy!