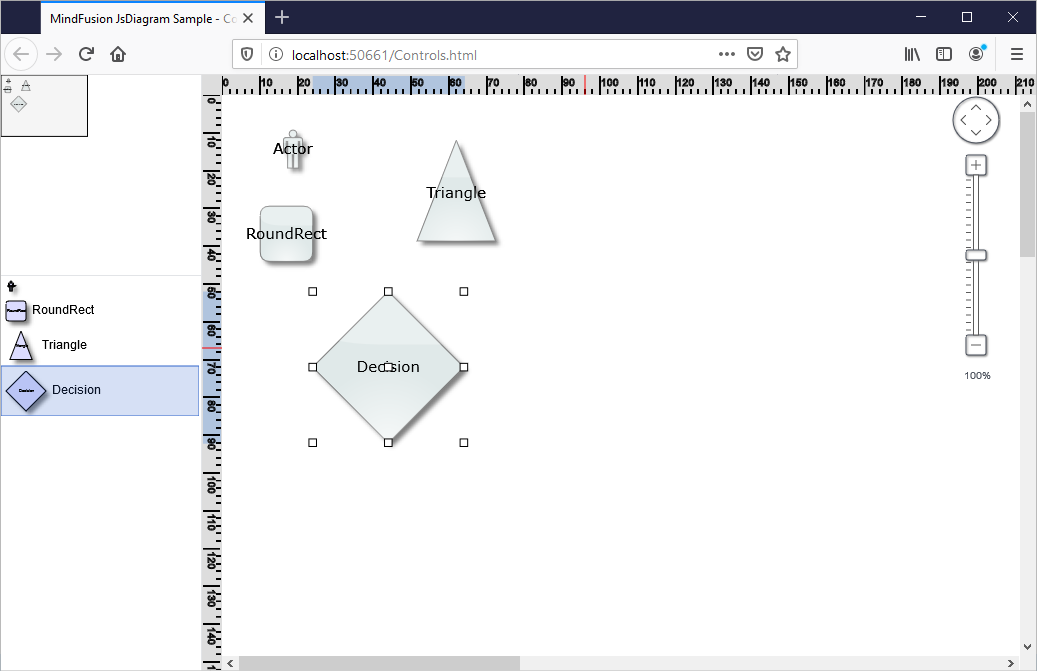
In this blog post we will learn how to add a NodeListView control to a Diagram and how to set its ShapeNode -s to a different size. When ShapeNode -s are dragged from the NodeListView the instances that will be created are proprtional in size to the size of the ShapeNode that was dragged. Here is a screenshot of the final application:

I. General Settings
We create an HTML page and add to it references to the MindFusion JavaScript files that represent the diagramming library:
<script src="MindFusion.Common.js" type="text/javascript"></script>
<script src="MindFusion.Diagramming.js" type="text/javascript"></script>
<script src="Controls.js" type="text/javascript"></script>
The last reference is to the Controls JavaScript file, where the code for the application is located.
Then we create two Canvas-es: one is for the NodeListView and the other is for the Diagram The NodeListView component is bound to the canvas element below:
<div style="width: 200px; height: 100%; overflow-y: auto; overflow-x: hidden; position: absolute; top: 201px; left: 0px; right: 0px; bottom: 0px;">
    <canvas id="nodeList" width="200"></canvas>
</div>

......

<!-- The Diagram component is bound to the canvas element below -->
<div style="position: absolute; left: 0px; top: 0px; right: 0px; bottom: 0px; overflow: auto;">
    <canvas id="diagram" width="2100" height="2100">
        This page requires a browser that supports HTML 5 Canvas element.
    </canvas>
</div>
Both the Diagram and NodeListView controls require Canvas elements to render themselves onto.
II. Initializing the Controls
We create the Diagram using the id that we’ve provided to its Canvas in the web page:
// create a Diagram component that wraps the "diagram" canvas
diagram = Diagram.create(document.getElementById("diagram"));
diagram.setBounds(new MindFusion.Drawing.Rect(0, 0, 500, 500));
We set a bigger size to the diagram in order to make it fill the web page.
We create the NodeListView instance the same way we created the diagram:
// create a NodeListView component that wraps the "nodeList" canvas
var nodeList = MindFusion.Diagramming.NodeListView.create(document.getElementById("nodeList"));
nodeList.setTargetView(document.getElementById("diagram"));
Now we need to add the settings that will make the ShapeNode -s different in size when rendered onto the list:
nodeList.setIconSize(null);
The setIconSize method is used to specify the default size of nodes in the NodeListView When we set the size to null, the control draws each node in the NodeListView with the size that was assigned to it:
function initNodeList(nodeList, diagram)
{
    // add some nodes to the NodeListView
    var shapes = ["Actor", "RoundRect", "Triangle", "Decision"];
    for (var i = 0; i < shapes.length; ++i)
    {
        var node = new MindFusion.Diagramming.ShapeNode(diagram);
        node.setText(shapes[i]);
        node.setShape(shapes[i]);
        node.setBounds(new MindFusion.Drawing.Rect(0, 0, (i+1)*10, (i+1)*10));
        nodeList.addNode(node, shapes[i]);
    }
}
Here we increase the size of wach ShapeNode with 10 points on each itereation. This makes the icons with various size but does not create them with different size when dropped on the diagram. In order to do this we must set:
nodeList.setDefaultNodeSize (null);
setDefaultNodeSize specifies the size of those nodes that are created when a ShapeNode is dropped on the Diagram area. By setting this size to null we tell the control to read the size of the new ShapeNode from the instance in the NodeListView control.
With that our sample is ready. You can download the source code from this link:
JavaScript NodeListView with Various Size Nodes: Download Sample
About Diagramming for JavaScript: This native JavaScript library provides developers with the ability to create and customize any type of diagram, decision tree, flowchart, class hierarchy, graph, genealogy tree and more. The control offers rich event set, numerous customization options, animations, graph operations, styling and themes. You have more than 100 predefined nodes, table nodes and more than 15 automatic layout algorithms. Learn more about Diagramming for JavaScript at https://mindfusion.eu/javascript-diagram.html.
