We have released the new version of the Java Diagram library. Here is a brief summary of the new features:
Fluent API
Builder classes in com.mindfusion.diagramming.builders package add support for fluent programming style. Static with and instance init methods in DiagramItem, DiagramItemStyle and Layout -derived classes return a builder instance that can be used to set up respective new or existing objects.
DiagramLink improvements
- The component no longer keeps a separate segmentCount field, removing a common source of errors. The SegmentCount property now calculates its value from ControlPoints elements. The updateFromPoints(updateGroups, updateSegments) overload has been removed too.
- SegmentCount setter no longer refuses changing number of segments if auto-routing is enabled or the link is a self-loop.
- The new Spline element of LinkShape enumeration draws links as interpolating splines that pass through all of their control points:
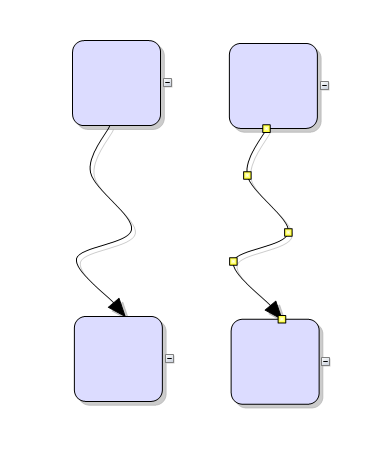
Java Diagram Library: Spline Links
Enum types
Old-style enumeration classes with static finals have been replaced by enum types, improving type checking and auto-completion support. This change will not affect your code if only passing enum members to methods from the API. If storing them in fields on the other hand, you must change the field type from int to respective enum type.
Several bug fixes
We have fixed a setLicenseKey problem and a bug with the SvgExporter.
You can find details about the new release at the official announcement page here.
The trial version is available for download from the following link:
Download MindFusion.Diagramming for Java Swing, V4.3 Trial Version
Technical support
MindFusion puts special effort in providing high quality technical support to all its current and future clients. You can post your questions about Diagramming for Java at the forum, help desk or at support@mindfusion.eu. All support inquiries are usually answered within hours of being received.
About Diagramming for Java Swing: MindFusion.Diagramming for Java Swing provides your Java application with all necessary functionality to create and customize a diagram. The library is very easy to integrate and program. There are numerous utility methods, rich event set, more than 100 predefined shapes. The tool supports a variety of ways to render or export the diagram, advanced node types like TreeView nodes, hierarchical nodes, tables, container nodes and many more. There are 15 automatic layouts, various input / output options and fully customizable appearance. A detailed list with JDiagram’s features is uploaded here. You can check the online demo to see some of the functionality implemented.
Diagramming for Java Swing is royalty free, there are no distribution fees. Licenses depend on the count of developers using the tool – check here the prices.