Negative Bar Stack in WinForms

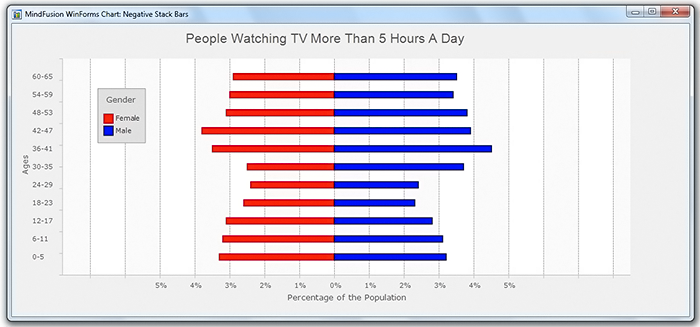
Thia post will demonstrate how to create a horizontal stacked bar chart with negative values. We will use the Charting for WinForms component and the final chart looks like this:

Negative Stacked Bar Chart in WinForms with the Chart Control

Negative Stacked Bar Chart in WinForms with the Chart Control

I. Data

The chart will use four series. The first two series are the ones that you clearly see – the red and blue one. We initialize two data arrays with random values that represent the data:

var firstBarX = new List(11);
var secondBarX = new List(11);

Random r = new Random();
            
for(int i = 0; i < 11; i++)
   {
       firstBarX.Add(2.2 + r.NextDouble());
       secondBarX.Add(2.4 + r.NextDouble());
    }

We need a list with data values that are exactly the same as the first series, but are negative. They will provide a transparent initial series, whose bars will offset the first, red, series as much as the value of the red bar should be:

//generate data for the transparent series
var transparentBarX = new List(firstBarX.Count);

for (var i = 0; i < firstBarX.Count; i++)			
    transparentBarX.Add(0 - firstBarX[i]);

The data for the Y-axis is very simple. We just need a list with the numbers from 1 to 12:

//data for the Y-axis
var barY = new List();
for (int i = 1; i < 12; i++)			
	barY.Add(i);

II. Labels
We will create two lists with the labels that we will show – for the two axis. The labels for the Y-axis will be used as tooltips as well. We just initialize two string lists:

//initialize labels for the X axis
var ageLabels = new List() { "0-5", "6-11", "12-17", "18-23", "24-29", "30-35",
		   "36-41", "42-47", "48-53", "54-59", "60-65" };

//initialize labels for the Y axis.
var percentageLabels = new List { "5%", "4%", "3%", "2%", "1%", "0%", 				"1%", "2%", "3%", "4%", "5%", };

We will use this label lists in the next section, when we create the series.

III. Series

We will use 4 series, of type Series2D. This series is useful for its SupportedLabels property – it allows us to specify what the labels of the series would be used for. We start with the transparent series. Its labels will be used for custom labels at the Y-axis:

var seriesTransparent = new MindFusion.Charting.Series2D(transparentBarX, barY, ageLabels);
seriesTransparent.SupportedLabels = MindFusion.Charting.LabelKinds.YAxisLabel;
seriesTransparent.Title = "";

We use for X-data the negative values you remember from the previous paragraph. The age labels are those that provide the data for the axis.

Then we initialize the two series for the chart data:

var seriesFirst = new MindFusion.Charting.Series2D(firstBarX, barY, ageLabels);
seriesFirst.SupportedLabels = MindFusion.Charting.LabelKinds.ToolTip;
seriesFirst.Title = "Female";

var seriesSecond = new MindFusion.Charting.Series2D(secondBarX, barY, ageLabels);
seriesSecond.SupportedLabels = MindFusion.Charting.LabelKinds.ToolTip;
seriesSecond.Title = "Male";

The last series that we create is just to provide data for the X-axis and we set its SupportedLabels property to MindFusion.Charting.LabelKinds.XAxisLabel. The X-data for this series corresponds to the coordinates of the X-labels, that’s why set the numbers from -5 to 5 as X-data:

var firstParamList = new List();
      for (int i = -5; i < 6; i++)			
	 firstParamList.Add(i);

The Y-data could be all zeros, we won’t use them anyway.

var secondParamList = new List();
    for (int i = 0; i < 12; i++)			
	secondParamList.Add(0);

And we create the series this way:

//the purpose of this series is to only supply the Xaxis labels, it is transparent.	
var seriesThird = new MindFusion.Charting.Series2D(firstParamList, secondParamList, percentageLabels);           	
seriesThird.SupportedLabels = MindFusion.Charting.LabelKinds.XAxisLabel;
seriesThird.Title = "";

After you have created all series, you should add them to the Series collection of the BarChart:

barChart.Series = new ObservableCollection
	{ seriesTransparent, seriesFirst, seriesSecond, seriesThird };
           	

IV. Axes and Grid

We need to fix the divisions of the X-axis if we want to show a grid and the grid to be neatly aligned with the axes. We will set the min value to be -6, the interval 1 and the max value to be 6:

barChart.XAxis.Interval = 1;
barChart.XAxis.MinValue = -6;
barChart.XAxis.MaxValue = 6;		

We will use three more properties to hide the interval labels at both axes, show ticks on them and set a title for each axis:

barChart.XAxis.Title = "Percentage of the Population";
barChart.YAxis.Title = "Ages";
			
barChart.ShowYCoordinates = false;
barChart.ShowXCoordinates = false;

barChart.ShowXTicks = true;
barChart.ShowYTicks = true;

Finally, we have to set the grid and specify that the bars are horizontal:

barChart.GridType = GridType.Vertical;
barChart.HorizontalBars = true;

V. Styling

Styling the chart is done though the SeriesSyle property of the Plot. You can assign to it different series types, you can check the list at the ISeriesStyle interface page in the documentation:

barChart.Plot.SeriesStyle = new PerSeriesStyle()
{
	Strokes = new List {
		firstBrush, new SolidBrush(Color.FromArgb(179, 0, 0)), 
                new SolidBrush(Color.FromArgb(0, 0, 102)), firstBrush
		},
		StrokeThicknesses = new List {
			 0,2,2,0
		},
		Fills = new List()
		{
			firstBrush, secondBrush, thirdBrush, firstBrush
	}
};

This style indicates that each brush from its collection will be used for one series in the chart. We assign to it 4 brushes and 4 strokes. The first brush is transparent, the second one is red, the other is blue and the last one is black – we won’t draw with it anyway.

The Theme property of the chart holds a lot of options for customizing the appearance. Here are just a few of them:

barChart.Theme.LegendBorderStrokeThickness = 1;
barChart.Theme.LegendBorderStroke = new SolidBrush(Color.Black);
barChart.Theme.GridColor2 = Color.White;
barChart.Theme.GridColor1 = Color.FromArgb(250, 250, 250);
barChart.Theme.GridLineColor = Color.FromArgb(153, 153, 153);
barChart.Theme.PlotBackground = new SolidBrush(Color.FloralWhite);
...........
..........

And that’s the end of this step-by-step guide. You can download the sample together will all necessary libraries from this link:

Download Negative Stack Bar Chart in CS Sample

About MindFusion Charting for WinForms: A versatile dashboard component that provides your WinForms application with the ability to create fascinating charts, interactive dashboards and practical gauges. The component combines a flexible API that allows custom combination of chart components to build any type of chart you want. You can add as many axes of any type you want, combine various chart series into a single chart with different data providers each. The control also supports pan and zoom, scroll, unlimited number of legends, grid and a dashboard panel. Linear and oval gauges complete the tool set and guarantee every feature you might need to build the perfect gauge, chart of any type or dashboard in WinForms is right at your fingertips. Learn more at https://mindfusion.eu/winforms-chart.html

Real-Time Chart in WinForms

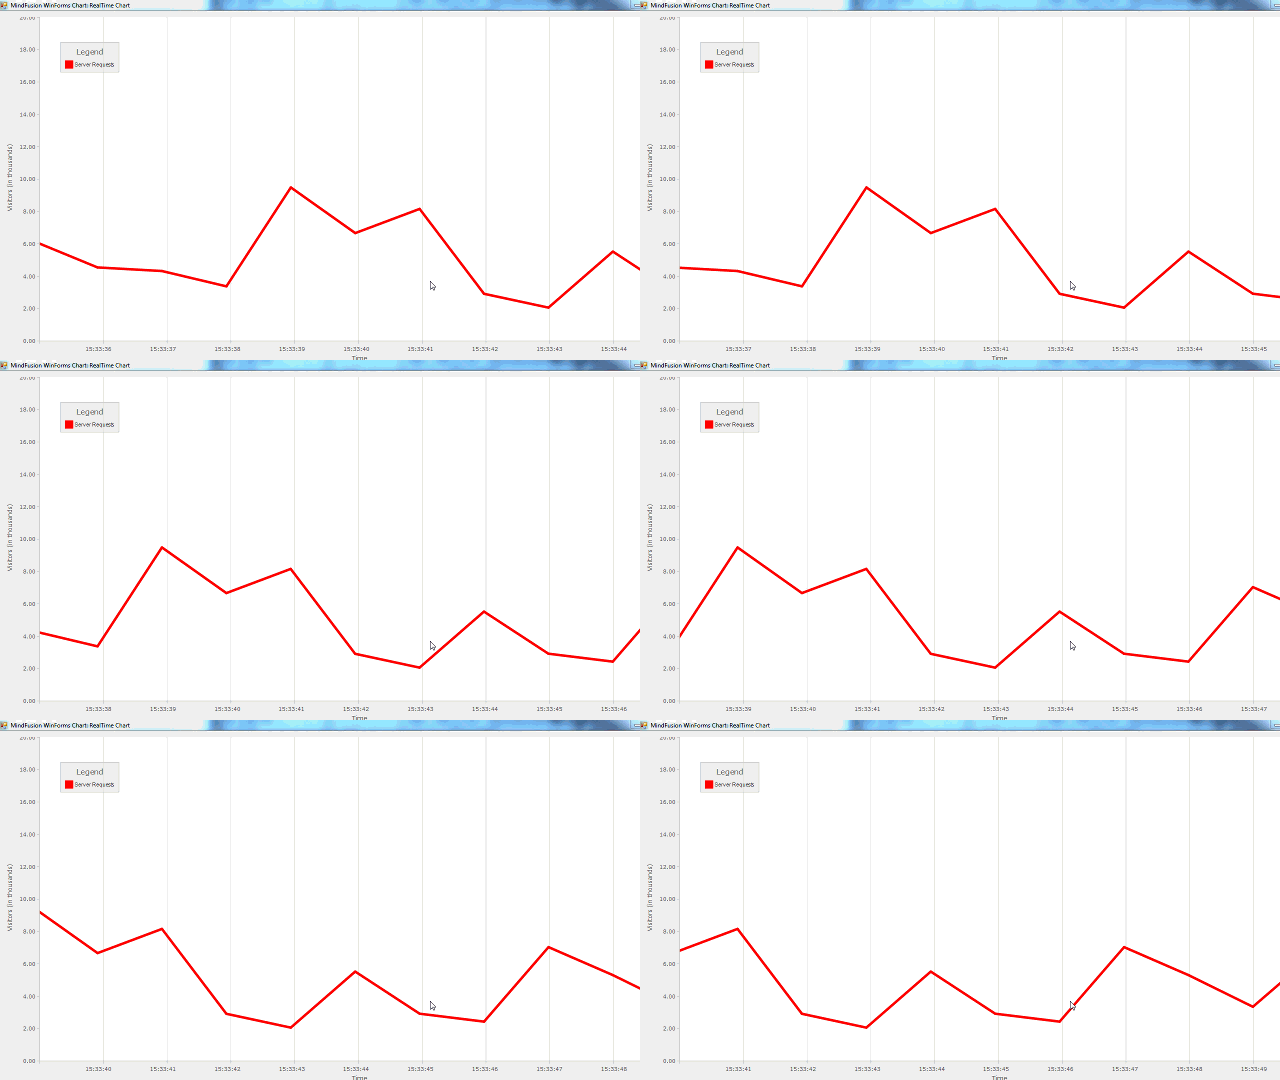
In this sample we will build a line chart that reads its data in real time and gets updated each second.

Real-time WinForms Chart

We start by creating an empty WinForms project. We assume you have installed the Charting for WinForms component and you can see a list with chart components in the VisualStudio toolbox.

Drag the LineChart control and drop it on the form. You should now see references to the three libraries that you need automatically added to your project:

  • MindFusion.Charting;
  • MindFusion.Charting.WinForms;
  • MindFusion.Common;

1. Series and Data

Our chart will render time stamps at the X-axis. That’s why we choose the DateTimeSeries class to create the series for the chart. The constructor requires two lists – one with DateTime values and one with double values. They provide data for the X and Y axes respectively. We must also provide two more parameters: one for the start and one for the end of the time period.

List dates = new List();
List values = new List();

In order to mimic the real-time functionality we will use a timer. Our timer will generate a random number each second. At the beginning we will have a list with no values. Gradually, we will fill the values and once we reach the count of 100 we will start to delete the first value and add a new value at the end of the arrays.

That’s how we initialize the timer:

Random ran;
ran = new Random();         
        
Timer dataTimer = new Timer();
dataTimer.Tick += new EventHandler(GenerateData);
dataTimer.Interval = 1000;
dataTimer.Start();

Let’s look at the GenerateData method:

private void GenerateData(object sender, EventArgs e)
    {
         dates.Add(DateTime.Now);
         values.Add(2 + ran.NextDouble() * 8.0);

         if (dates.Count > 100)
         {
             dates.RemoveAt(0);
             values.RemoveAt(0);
         }
...
}

There we always add the current DateTime. Since the timer ticks every second that’s exactly what we want. Once the values are 100, we start to remove values at the beginning of the list.

Now let’s create the DateTime series. It requires parameters for the start and end of the period. We always allocate the first and last DateTime values as the bounds of the DateTime data for this series:

DateTimeSeries series = new DateTimeSeries(dates, values, dates[0], dates[dates.Count-1]);

Then we see if we have already added a Series and if so – replace it. If no Series has been added – add the new one:

if (lineChart1.Series.Count > 0)
       lineChart1.Series[0] = series;
else
       lineChart1.Series.Add(series);

By default the DateTimeSeries renders its values from the X-axis – the DateTime instances as labels at the X-axis. We can customize how they look with the DateTimeFormat property. The predefined DateTimeFormat members don’t have an option where the values are rendered as “14:23:34” as a time stamp. So, we choose as DateTimeFormat “CustomDateTime” and use the CustomDateTime to specify the format:

series.DateTimeFormat = DateTimeFormat.CustomDateTime;
series.CustomDateTimeFormat = "H:mm:ss"; 

2. The X-Axis

We want at each moment only the last 10 values to be visible. The other 90 or however they are should be rendered but the user must scroll to see them. We achieve with the MinValue and MaxValue properties of the DateTimeSeries:

series.MinValue = 0;
series.MaxValue = 0.1 * dates.Count;

In order to render only the last 10 series, we use the XAxis properties – MaxValue and MinValue Once the MaxValue of the DateTimeSeries is more than 1, which means that at least 10 values have been added, we adjust the visible range of values at the X-axis so that only the last 10 are visible:

if (series.MaxValue > 1)
  {
      lineChart1.XAxis.MaxValue = series.MaxValue;
      lineChart1.XAxis.MinValue = series.MaxValue - 1.0;
  }

We also set the Title for this axis:

lineChart1.XAxis.Title = "Time";

Let’s hide the numeric values from rendering at the top of the DateTime stamps with the ShowXCoordinates property:

lineChart1.ShowXCoordinates = false; 

3. The Y-Axis

By default the range of an axis is calculated based on the data. Let’s make our chart render the line graphics more to the beginning of the axis by increasing the MaxValue of the Y-axis while we fix the MinValue at 0:

lineChart1.YAxis.MinValue = 0;
lineChart1.YAxis.MaxValue = 20;
lineChart1.YAxis.Interval = 2;

We also change the axis Title and we use NumberFormat property to render the intervals with floating points:

lineChart1.YAxis.Title = "Visitors (in thousands)";
lineChart1.YAxis.NumberFormat = "N";

4. Grid

Let’s render vertical grid stripes. We want them to be dashed and light gray. We use GridType GridColor and GridLineStyle to customize the grid:

lineChart1.GridType = GridType.Vertical;
lineChart1.Theme.GridLineStyle = System.Drawing.Drawing2D.DashStyle.Dash;
lineChart1.Theme.GridLineColor = Color.FromArgb(192, 192, 192);

Note that GridColor and GridLineStyle are properties of the Theme property of LineChart add one extra – stop the grid stripes from moving around when the user scrolls the chart along the axis:

lineChart1.PinGrid = true;

5. Legend

The legend gets its labels from the Title property of a Series. In our case we set:

series.Title = "Server Requests";

We would like to change the legend background to make the legend easier to spot:

lineChart1.Theme.LegendBackground = new MindFusion.Drawing.SolidBrush(Color.FromArgb(120, 230, 230, 230));

We use a semi-transparent brush that let’s chart details be visible when the user moves the legend onto another chart element.

6. Line Colors

We want to render the line in red. We choose the MixedSeriesStyle class as the styling class for our application. You can use any other *SeriesStyle class that is appropriate in your case:

// assign a reb brush for the series
lineChart1.Plot.SeriesStyle = new MixedSeriesStyle()
    {  
         UniformStrokeThickness = 5,
         UniformStroke = new MindFusion.Drawing.SolidBrush(Color.Red),
         UniformFill = new MindFusion.Drawing.SolidBrush(Color.Red)
     };

With that our sample is complete. You can download the full code with the necessary charting dll-s from this link:

Download the WinForms Real-TimeChart Sample

About MindFusion Charting for WinForms: A versatile dashboard component that provides your WinForms application with the ability to create fascinating charts, interactive dashboards and practical gauges. The component combines a flexible API that allows custom combination of chart components to build any type of chart you want. You can add as many axes of any type you want, combine various chart series into a single chart with different data providers each. The control also supports pan and zoom, scroll, unlimited number of legends, grid and a dashboard panel. Linear and oval gauges complete the tool set and guarantee every feature you might need to build the perfect gauge, chart of any type or dashboard in WinForms is right at your fingertips. Learn more at https://mindfusion.eu/winforms-chart.html

A JavaScript Application for Server Load Monitoring (Continued)

We continue the ServerLoad tutorial with the diagram.

I. Create and Style The Diagram

We create a new JavaScript file named diagram.js in the Scripts folder of the project and reference it in the HTML.

<a href="http://Scripts/MindFusion.Diagramming.js">http://Scripts/MindFusion.Diagramming.js</a>

Now, in this file we make some namespace mapping to access easy the classes we need:

var Diagram = MindFusion.Diagramming.Diagram;
var DiagramLink = MindFusion.Diagramming.DiagramLink;
var ShapeNode = MindFusion.Diagramming.ShapeNode;
var Style = MindFusion.Diagramming.Style;
var DashStyle = MindFusion.Drawing.DashStyle;
var Alignment = MindFusion.Diagramming.Alignment;

var Rect = MindFusion.Drawing.Rect;
var LayeredLayout = MindFusion.Graphs.LayeredLayout;
var LayoutDirection = MindFusion.Graphs.LayoutDirection;

// a shortcut to the Events class
var Events = MindFusion.Diagramming.Events;

The code for the diagram does not need to be in a single method call, so we’ll use the document.ready event handler:

$(document).ready(function () {

// create a Diagram component that wraps the "diagram" canvas
diagram = MindFusion.AbstractionLayer.createControl(Diagram, null, null, null, $("#diagram")[0]);
//set both base and head link shape size
diagram.setLinkHeadShapeSize(2);
diagram.setLinkBaseShapeSize(2);
diagram.setLinkBaseShape(MindFusion.Diagramming.Shape.fromId("Arrow"));
................

});

As with the line chart, we create a diagram object using the canvas id from the html page. Then we make some link customization: we set the base and head shape with setBaseShape and setHeadShape to “Arrow” to indicate that data flows in two directions between servers.

Now let’s use a Style instance to set the stroke, text color and font name. Then we set the link style this way:

//customize the link appearance
var linkStyle = new Style();
linkStyle.setStroke("#c0c0c0");
linkStyle.setTextColor("#585A5C");
linkStyle.setFontName("Verdana");
linkStyle.setFontSize(3);
diagram.setStyle(linkStyle);

When users click on the diagram it is important not to allow them to create new links and nodes. That’s why we use setBehavior to change the default way the diagram responds to user actions:

//diagram items can only be selected
diagram.setBehavior(MindFusion.Diagramming.Behavior.SelectOnly);

We create the graph in the buildDiagram method. First, we call clearAll to remove all diagram items to make sure only nodes we’ve created are visible:

//generate diagram nodes
function buildDiagram() {
 diagram.clearAll();

};

II. Diagram Items

Let’s create the diagram nodes. We use png icons we’ve saved in an “icons” folder in the website. The background of each node is transparent ( setTransparent ), which means only the image will be visible. Then we add the node to the items of the diagram:

var rect = new Rect(0, 0, 15, 15);

var node = new ShapeNode(diagram);
node.setBounds(rect);
//the web server
node.setImageLocation("icons/web_server.png");
node.setTransparent(true);
diagram.addItem(node);

We create similar nodes for the data server, the clients and the network servers. The links are created with the DiagramLink class. The constructor takes the origin and target node of the link as parameters. We set an setId to the links, which is important and we add a label :

//add a link between the client and the server
var link = new DiagramLink(
       diagram, node, diagram.nodes[0]);
//same as the title of a given chart series
link.setId("Client" + i);
link.addLabel("Client" + i);
diagram.addItem(link);

Let’s not forget to emphasize the two links that correspond to the two series that are initially emphasized on the chart:

//bolden the two major links
diagram.links[5].setStrokeThickness(2.0);
diagram.links[8].setStrokeThickness(2.0);

III. Layout

We’ve created the diagram items but we need to arrange them. We use the LayeredLayout algorithm:

//the layeredLayout arranges the diagram properly - into layers
function applyLayeredLayout() {
    var layout = new LayeredLayout();
    layout.direction = LayoutDirection.TopToBottom;
    layout.siftingRounds = 0;
    layout.nodeDistance = 20;
    layout.layerDistance = 20;
    diagram.arrange(layout);
    diagram.resizeToFitItems();
}

As you see it is very easy to apply a layout with the diagramming control. You just create an instance of the layout, set the properties of your choice and call arrange (). In our case we need the layout direction to be LayoutDirection.TopToBottom We also adjust the nodeDistance and layerDistance and set the number of siftingRounds (attempts to unwind split links) to 0.

IV. Events

The diagram is meant to be interactive. We use the linkSelected and clicked events to handle selection of links and click on an area of the diagram, unoccupied by any items.

// add listeners
diagram.addEventListener(Events.linkSelected, onLinkSelected);
diagram.addEventListener(Events.clicked, onClicked);

When a link is selected, we need to emphasize the line graphic that corresponds to this link. We also emphasize the link itself. In addition, we must adjust the stroke and thickness of the other line graphs and diagram links. We do this in the onLinkSelected method:

//handle the linkSelected event
function onLinkSelected(sender, args) {

    //get the style of the series
    var seriesStyle = lineChart.plot.seriesStyle;
    seriesStyle.strokeThicknesses.clear();

    //thicken just the selected series, the others should be transparent
    for (var j = 0; j < lineChart.series.count() ; j++) {
        seriesStyle.strokeThicknesses.add(0.15);
        diagram.links[j].setStrokeThickness(1.0);
    }
.....
}


First we get the series style and then we use setStrokeThickness to reset the thickness of diagram links and series to their default values. After we’ve done that we need to get the selected links and emphasize them:

//bolden all selected links in the diagram as well
for (var m = 0; m < diagram.selection.links.length; m++) {
     var clickedLinkId = diagram.selection.links[m].getId();
     diagram.selection.links[m].setStrokeThickness(3.0);

When we’ve done that we need to find the series that correspond to these links and emphasize them as well:

//find the series that correspond to the selected links
for (var i = 0; i < lineChart.series.count() ; i++) {
      var _series = lineChart.series.item(i);


      //adjust the stroke thicknesses
      if (_series.title == clickedLinkId) {

          seriesStyle.strokeThicknesses.removeAt(i);
          seriesStyle.strokeThicknesses.insert(i, 3);
      }

   }

All this is followed by a call to the draw method that repaints the chart.

//repaint the chart
lineChart.draw();

The next event handler – the onClicked method resets the thicknesses to their default values:

//reset the chart thicknesses
function onClicked(sender, args) {
    resetThicknesses();

}

This is done in the resetThicknesses method, which uses the seriesStyle field of the line chart:

/* bolden the two major series, the others should be very thin.
bolden the two major diaglinks as well. */
function resetThicknesses() {
   var seriesStyle = lineChart.plot.seriesStyle;
   seriesStyle.strokeThicknesses.clear();

   for (var j = 0; j < 5; j++) {
      seriesStyle.strokeThicknesses.add(0.15);
      diagram.links[j].setStrokeThickness(1.0);
   }
.......
}


V. Tyre Separators

The diagram is divided into three parts by three separator lines. These lines are unconnected DiagramLink instances that have no head and base shape and have a custom position for the label. We use absolute positioning to locate the arrows. To do this we need to know the current size of the diagram:

//add the separators for the tyres
//first get the size of the diagram
var width = diagram.getBounds().width;
var height = diagram.getBounds().height;

Then the separator link is created with both origin and destination node being null:

//separator for the Clients tyre
//the link starts from the left edge and eds to the right edge of the digram
var link = new DiagramLink(
		diagram, new MindFusion.Drawing.Point(2, (height / 3.5)),
        new MindFusion.Drawing.Point(width, (height / 3.5)));
link.setShadowOffsetX(0);
link.setShadowOffsetY(0);
link.setStrokeDashStyle(DashStyle.Dash);
link.setStroke("#DCDCDC");
//remove the shapes at both ends
link.setHeadShape(null);
link.setBaseShape(null);
//do not allow this link to be selected
link.setLocked(true);
//move the link label to the right
var linkLabel = link.addLabel("Clients");
linkLabel.setControlPointPosition(1, -5, 0);
diagram.addItem(link);

Note that we’ve used the setLocked property of the link and have set it to true. This means the link cannot participate in user interaction – it can’t be selected, moved, resized. That’s what we want.

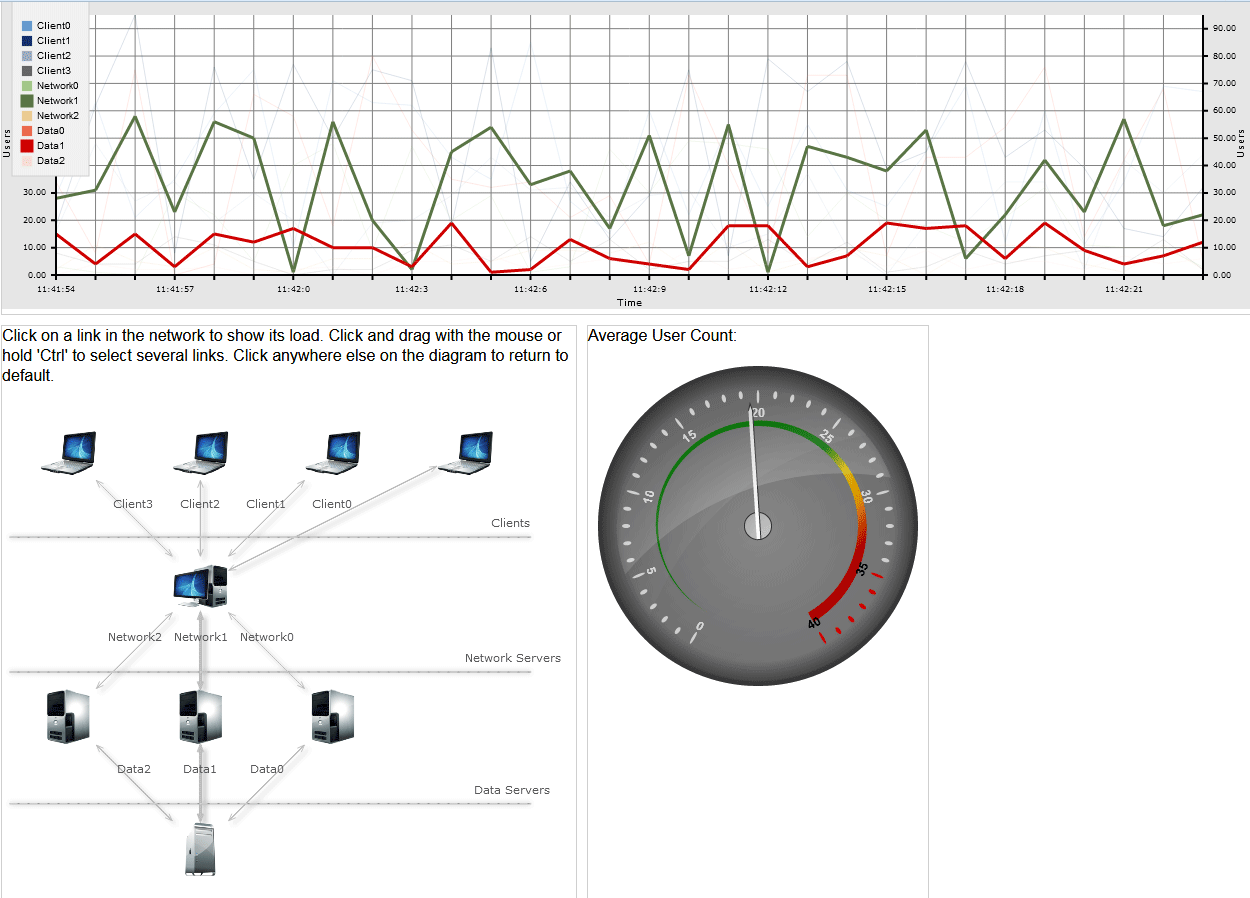
And with this our sample server load application is ready. Once again, here is how it looks:

Server Load Application in JavaScript

Server Load Application in JavaScript

Run The Application

Use this link to download the full sample with all necessary libraries and scripts.

Download Source Code

You can also fork it from GitHub.

Visit the web pages of the diagramming and charting (with gauges) JavaScript libraries to learn more about these tools. Visit the MindFusion forums if you need technical support or want to ask further questions about MindFusion developer tools.

A JavaScript Application for Server Load Monitoring

In two blog posts we will look at the main steps to create a sample server load web application. We will use the chart, gauge and diagram libraries. The data is simulated with random numbers.

Server Load Application in JavaScript

Server Load Application in JavaScript

Run The Application

The chart shows number of users on a given connection between two stations in the network at each moment. The graphic includes data for the last 30 seconds. The diagram shows the servers and clients that build the network. By default the charts shows data only for the two most important connections, out of total 10. Users can select different connections and view their graphics. The gauge control provides data for the average count of users at any given moment.

I. Project Setup

We create an empty website and add a Scripts folder with the necessary files:

MindFusion.Gauges.js
MindFusion.Diagramming.js
MindFusion.Common.js
MindFusion.Charting.js
require.js

and a reference to jQuery or the jQuery library itself:

jquery.js

We create a blank HTML file and we create three HTML Canvas elements – one for each of the controls: chart, diagram, gauge.

We use the Flexbox layout and we create a CSS file referenced by the index.html file where we write the CSS settings for the layout:


We initialize a section region that would have a Flexbox layout:

section {
   display: flex;
   max-width: 700px;
}


The CSS class used for <div> elements inside <section>:

.column {
  margin: 10px 10px 0px 0px;
  flex: 1 1 0;
  border: 1px solid #cecece;
}

section:first-of-type .column:first-of-type {
  flex: 1 1 auto;
}

We specify that the first column on the second row would be twice wider than the other column. This is the diagram, and the other column is occupied by the gauge.

section:nth-of-type(2) .column:first-of-type {
  flex: 2 2 22;
}


That’s how the HTML uses the CSS attributes:

<section>
<div class="column"></div>
</section>

Note the id=”lineChart” attribute – we will use the id to initialize the LineChart object in the *.js file. The diagram and gauge Canvas instances also have id-s.

At the end of the index.html we include a reference to the require.js file to load the chart and gauge libraries this way:

<script src="Scripts/diagram.js" type="text/javascript"></script>
<script data-main="charts" src="Scripts/require.js"></script>

Note: Internet Explorer might not load properly the JavaScript libraries if they are declared at the beginning of the file, (in the head section) before the initialization of the Canvas-es. Therefore it is best to put the script references at the bottom, right before the closing </body> tag.

II. The Gauge

The code for the OvalGauge and the LineChart is in a single method:

var lineChart = null;

define(["require", "exports", 'MindFusion.Common', 'Scripts/MindFusion.Charting', 'MindFusion.Gauges'], function (require, exports, MindFusion_Common_1, m, g) {
    "use strict";
.........
.........
} 


Before the method we declare a global variable for the LineChart. We need to access it in the diagram file so it must have a global visibility.

The OvalGauge control is created using the id of the HTML Canvas:

var userCounter = g.OvalGauge.create($('#userCounter')[0], false);


We will use two Events – raised before the background was painted and before the pointer was painted – to customize how the gauge background and pointer look.

//use custom painting of the background and of the pointer
userCounter.addEventListener(g.Events.prepaintBackground, onGaugerepaintBackground.bind(this));
userCounter.addEventListener(g.Events.prepaintPointer, onPrepaintPointer.bind(this));


The gauge needs a scale – we create an OvalScale and set its min and max value:

var scale = new g.OvalScale(userCounter);
scale.setMinValue(0);
scale.setMaxValue(40);
................


We will also set all three types of settings on the scale – MajorTickSettings, MiddleTickSettings and MinorTickSettings

//initialize the major settings
var majorSettings = scale.majorTickSettings;
majorSettings.setTickShape(TickShape.Ellipse);
..........................


A CustomInterval at the MajorTickSettings indicates a special range. We will use one to paint in red the portion on the scale that corresponds to the high amount of users:

 var interval = new g.CustomInterval();
    interval.setMinValue(35);
    interval.setFill('Red');
    majorSettings.addCustomInterval(interval);


Then we customize the MajorTickSettings, the MiddleTickSettings and MinorTickSettings:

//initialize the middle settings
var middleSettings = scale.middleTickSettings;
middleSettings.setShowLabels(false);
...............

//initalize the minor settings
var minorSettings = scale.minorTickSettings;
minorSettings.setShowLabels(false);
minorSettings.setShowTicks(false);


The scale shows a Range: that is a visual indication of regions on the gauge. It is determined by its setMinValue and setMaxValue values and in our case we will show it on the whole gauge:

//add a range in gradient colors
var range = new g.Range();
range.setMinValue(0);
range.setMaxValue(40);
range.setFill(g.Utils.createLinearGradient(320, [1, '#ce0000', 0.8, '#ce0000', 0.7, '#FFA500', 0.6, '#FFD700', 0.5, '#008000', 0, '#008000']));
...............
scale.addRange(range);


That’s how we handle the PrepaintBackground event to draw custom background for the gauge:

//paint the background in gradient
function onGaugerepaintBackground(sender, args) {
   args.setCancelDefaultPainting(true);
   var context = args.getContext();
   var element = args.getElement();
   var size = sender.getSize();
   var ellipse = new g.Ellipse();
   ellipse.setFill('gray');
   ellipse.setStroke('transparent');
   args.paintVisualElement(ellipse, size);
   var ellipse = new g.Ellipse();
   ellipse.setFill(g.Utils.createLinearGradient(300, [0, '#808080', 0.2, '#808080', 0.8, '#909090', 1, '#909090']));
   ellipse.setStroke('transparent');
   ellipse.setMargin(new g.Thickness(0.015));
   args.paintVisualElement(ellipse, size);
}


The code that handles the prepaint pointer event is similar. The value of the Pointer is set this way:

//add some initial value
pointer.setValue(26);


When the last chart values changes – each second – we update the pointer value:

var pointer = userCounter.scales[0].pointers[0];
pointer.setValue(sum/10);


III. The Chart

First we create the LineChart object from the Canvas that we have initialized in the HTML. We take the width and height of the control from its parent container:

var lineChartEl = document.getElementById('lineChart');
lineChartEl.width = lineChartEl.offsetParent.clientWidth;
lineChartEl.height = lineChartEl.offsetParent.clientHeight;
lineChart = new Controls.LineChart(lineChartEl);


The data for the line series is stored in 10 Series2D instances. For each of them we need a list with the X and Y values. The X-values are the same for all series, the Y-values are randomly generated numbers. All of them are instances of the List class:

var values1 = new Collections.List();
var values2 = new Collections.List();
......................................
var xValues = new Collections.List();
var xLabels = new Collections.List();


Here we fill the xValues list with numbers:

//initialize x-values and labels, generate sample data for the series
for (var i = 0; i < 30; i++) {
  xValues.add(i);
  setXLabels(false);
  generateData();
}


The setXLabels method takes care of the custom labels at the X-axis. At each 3rd call, it removes the first three values and adds three new ones: one with the current time stamp and two more as empty strings.

if (d.getSeconds() % 3 == 0)
   {
     //clear the first three values
     //if the count of the labels is more than 30
     if (removeFirst) {
         xLabels.removeAt(0);
         xLabels.removeAt(0);
         xLabels.removeAt(0);
       }

       //add a label and two empty strings
       xLabels.add(d.getHours() + ":" + d.getMinutes() + ":" + d.getSeconds());
       xLabels.add("");
       xLabels.add("");                
    }   


We create the Series2D instances and add them to the Series property of the line chart:

//the series for the chart
var series = new Collections.ObservableCollection(new Array(
    new Charting.Series2D(xValues, values1, xLabels),
    new Charting.Series2D(xValues, values2, null),
    ...........
    new Charting.Series2D(xValues, values10, null)));


The xLables are assigned just to the first series, they will serve as labels source for the X-axis.To show them, we must first hide the coordinates and assign them to the xAxis:

lineChart.xAxis.labels = xLabels;
lineChart.showXCoordinates = false;


then we must “tell” the first series that its labels are used for the XAxis:

//tell the series that the labels are for the X-axis.
series.item(0).supportedLabels = m.MindFusion.Charting.LabelKinds.XAxisLabel;


We use the title property of a Series object to identify the series. That’s why we assign to them unique labels:

//series titles are important - we identify the series with them
for (var i = 0; i < 4; i++)
    series.item(i).title = "Client" + i;

for (var i = 0; i < 3; i++)
    series.item(i + 4).title ="Network" + i;

for (var i = 0; i < 3; i++)
    series.item(i + 7).title ="Data" + i;


Since it is going to be a long chart, we want a second Y-axis to appear to the right. That can be done by adding another YAxisRenderer with the same yAxis to the components rendered by default by the LineChart control. We add the new YAxisRenderer to a vertical StackPanel:

 var y2Stack = new m.MindFusion.Charting.Components.StackPanel();
 y2Stack.orientation = m.MindFusion.Charting.Components.Orientation.Vertical;
 y2Stack.gridRow = 0;
 //add the stack panel to the last grid column
 y2Stack.gridColumn = lineChart.chartPanel.columns.count() - 1;

 lineChart.chartPanel.children.add(y2Stack);


The layout manager for a LineChart is a Grid panel. We add a new column to it, where the second Y-axis will be rendered. Then we add the StackPanel with the YAxisRenderer to this column. Next we add the yAxis and we specify that the plot is not to the left side of it:

//create the second Y-axis
var secondYAxis = new Charting.YAxisRenderer(lineChart.yAxis);
secondYAxis.plotLeftSide = false;
lineChart.yAxisRenderers.add(secondYAxis);
y2Stack.children.add(secondYAxis); 


Then we customize the grid and trigger the timer that will update the data values at each second:

lineChart.gridType = Charting.GridType.Crossed;
lineChart.backColor = new Drawing.Color.fromArgb(230, 230, 230);
lineChart.theme.gridColor1 = Drawing.Color.fromArgb(1, 255, 255, 255);
lineChart.theme.gridColor2 = Drawing.Color.fromArgb(1, 255, 255, 255);
lineChart.theme.gridLineColor = Drawing.Color.fromArgb(0.5, 240, 240, 240);
//start the timer
setInterval(setTime, 1000);


Finally, let’s look at the styling of the series. We keep the brushes in a list. The colors for those brushes are stored in a list with lists – each one with three elements for the red, green and blue values of the color.

//the colors for the brushes
var brushes = new Collections.List();

var rgbColors = new Collections.List();
rgbColors.add(new Array(102, 154, 204));
..............


What we actually do to show the graphics of the connections that are selected in the diagram is thicken the strokes for those line graphics and set the thickness to the rest to 0.15 to make them barely visible.

We do that by using the thicknesses property of the PerSeriesStyle class that we use for styling the chart.

lineChart.plot.seriesStyle = new Charting.PerSeriesStyle(brushes, brushes, thicknesses);


And here is how we create the thicknesses and the brushes:

//create brushes for the chart
var thicknesses = new Collections.List();
  for (var i = 0; i < 10; i++)
   {        
      var a = rgbColors.item(i);
      brushes.add(new Drawing.Brush(new Drawing.Color.fromArgb(a[0], a[1], a[2])));
      if (i == 5 || i == 8)
          thicknesses.add(3.0);
      else
         thicknesses.add(0.15);
      
  }


Only the 5th and 8th thickness are set to 3, the others are almost zero – enough to draw the silhouettes of the graphics.

And that’s all for this part I of the tutorial on how to build the client side of a sample server load monitor application in JavaScript. In part II we will look at the diagram control. You can run the sample from here:

Run the online server load monitor application

Here is the link to download the full source code for the application:

Download Source Code

You can also fork it from GitHub.

Find out more about the chart, gauge and diagram JavaScript libraries from their official pages on the MindFusion website.

A Poll Chart: A Stacked Bar Chart in Java Swing that Represents Results of a Survey

Part I: Overview of chart elements, the dashboard, plot and axes.

Part II : Bar series and their drawing, rendering of custom labels with AnnotationRenderer-s.

In this blog post we will build a horizontal stacked bar chart in Java. To build the chart we use the Java chart library. We want to add a few custom elements to the chart and that’s why we will use the Dashboard control that gives us complete control over the chart elements that we use and how to arrange them.

I. Chart Elements

We use the following chart elements:

The image below gives you a visual presentation on how the components used are arranged:

The chart elements that build this stacked bar chart

The chart elements that build this stacked bar chart

The GridPanel has two rows and two columns. On the first row is the XAxisRenderer , that renders the X-axis, on the second row is the YAxisRenderer and the Plot with the BarStackRenderer .

II. The Dashboard

First, we create the Dashboard and add some styling to it with a Theme . The Theme class allows us to specify all appearance settings of a chart. We set only those that we want to use: the grid, the font:

Dashboard board = new Dashboard();
						
// set up appearance
Theme theme = board.getTheme();
theme.setPlotBorderStrokeThickness(0);
theme.setTitleBrush(new SolidBrush(Color.black));
theme.setGridColor1(Color.white);
theme.setGridColor2(new Color(240, 240, 240));
theme.setGridLineColor(new Color(255, 255, 255));

We add the TextComponent for the title and the GridPanel to the LayoutPanel of the Dashboard . The LayoutPanel is a vertical StackPanel and it arranges the elements exactly as we want them to appear:

board.getLayoutPanel().getChildren().add(title);
board.getLayoutPanel().getChildren().add(panel);

getContentPane().setLayout(new BorderLayout());
getContentPane().add(board, BorderLayout.CENTER);

We make sure the ContentPane of the JFrame that our Swing application uses applies the BorderLayout on the Dashboard and places it in the center which means it will stretch automatically when the user changes the size of the JFrame.

III. The Plot

The plot for the Chart is a Plot2D control. It will hold the BarRenderer and the two AnnotationRenderer -s. First, we set some general options: that the plot allows span, that it stretches in both directions and it will render a vertical grid.

//create the Plot2D
Plot2D out = new Plot2D();	
out.setAllowPan(true);
out.setHighlightStrokeDashStyle(DashStyle.Dash);
out.setHorizontalAlignment(LayoutAlignment.Stretch);
out.setVerticalAlignment(LayoutAlignment.Stretch);
out.setGridType(GridType.Vertical);

Then we go on with the styling options. The colors for the bars are set by a SeriesStyle class. We use an instance of the PerSeriesStyle which assings one brush and one fill for all elements in a single Series. We also set the HighlightStroke, which is the Brush that is used to highlight the bar that is selected:

List fills = fill();
List strokes = stroke();
out.setBackground(new SolidBrush(Color.white));
out.setVerticalScroll(true);
out.setSeriesStyle(new PerSeriesStyle(fills, strokes, Arrays.asList(5.0), null));		
out.setHighlightStroke(new SolidBrush(new Color(0, 0, 99)));

Finally we indicate the location of the plot in the GridPanel (more about the grid later):

//position in the grid
out.setGridColumn(1);
out.setGridRow(1);

IV. Axes

The axes are two – X and Y. The Y axis is present, but not visible. The X-axis is visible, aligned to the top and does not draw labels. The Axis are instances of the Axis class. They both use AxisRenderer instances to be drawn:

xAxis = new Axis();
xAxis.setMinValue(0.0);
xAxis.setMaxValue(300.0);
xAxis.setInterval(50);		
xAxis.setTitle("");		

The intervals of the axis are important because they determine the location of the grid stripes. The Axis sets some apperance properties like brush and font for the labels.

//the xAxisRenderer is bound to the xAxis
xAxisRenderer = new XAxisRenderer(xAxis);			
xAxisRenderer.setAxisStroke(new SolidBrush(Colors.Black));
xAxisRenderer.setAxisStrokeThickness(1.0);
xAxisRenderer.setLabelFontSize(12.0);
xAxisRenderer.setLabelBrush(new SolidBrush(Colors.Black));

Then comes the importnat part: we must tell this Axis that its labels come from an AnnotationRenderer , that it must not draw its intervals and that the labels are drawn above, rather than below the axis line:

//axis labels will be rendered by an AnnotationRenderer
xAxisRenderer.setLabelsSource(annotationRenderer1);
xAxisRenderer.setShowCoordinates(false);		
xAxisRenderer.setPlotBottomSide(false);

Finally, we specify its location and stretch settings:

//stretch this horizontal axis
xAxisRenderer.setHorizontalAlignment(LayoutAlignment.Stretch);
   	
//position in the Grid
xAxisRenderer.setGridColumn(1);
xAxisRenderer.setGridRow(0); 

The Y-axis is similar to the X-axis, so we won’t describe its settings here. Here is the final chart:

A stacked bar chart in Java Swing

Poll chart in Java Swing

This is the end of the Part I of this tutorial. In part II we’ll cover the BarRenderer with the BarSeries and the AnnotationRenderer-s. We will also briefly discuss the GridPanel.

You can download the complete source code of the sample from here:

Download The Stacked Bar Chart in Java Sample

About Charting for Java: MindFusion.Charting for Java Swing is a multipurpose graphics library that lets you create and customize a large variety of chart types: bar, column, pie, doughnut, radar, polar etc., candlestick financial charts, gauges and dashboards with dynamic layout of their components. The library boasts a smart API which lets you combine and arrange multiple lots, axes, legends, images and other chart components. The chart appearance can be customized on multiple levels – from properties applied on a single element to global themes reused by all charts and series. Charts use a uniform Series interface for reading data and labels. You can implement the interface and create custom Series that matches your data source. Written in pure Java, this tool provides every type of Java Swing application with powerful charting capabilities. Read more about the component from here.