In this post we’ll demonstrate how to create a graphical interface for editing dialogues using MindFusion diagramming API. The sample could be used as a module in different kinds of applications, such as software for creating and conducting surveys, editing interactive voice response systems, designing NPC dialogues in game development tools. You can download the complete project here:
DialogueEditor.zip
The sample code will show several features of Diagram control:
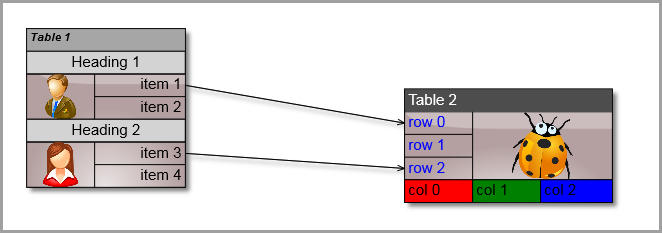
- TableNode API
- in-place edit
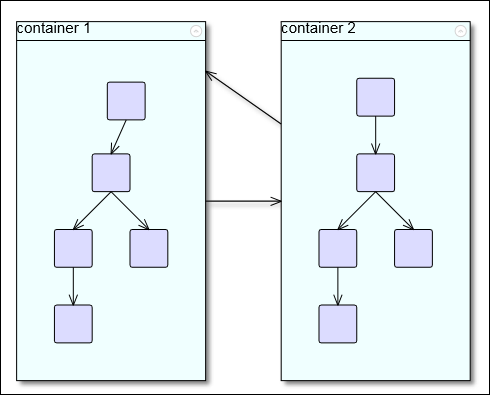
- work with groups
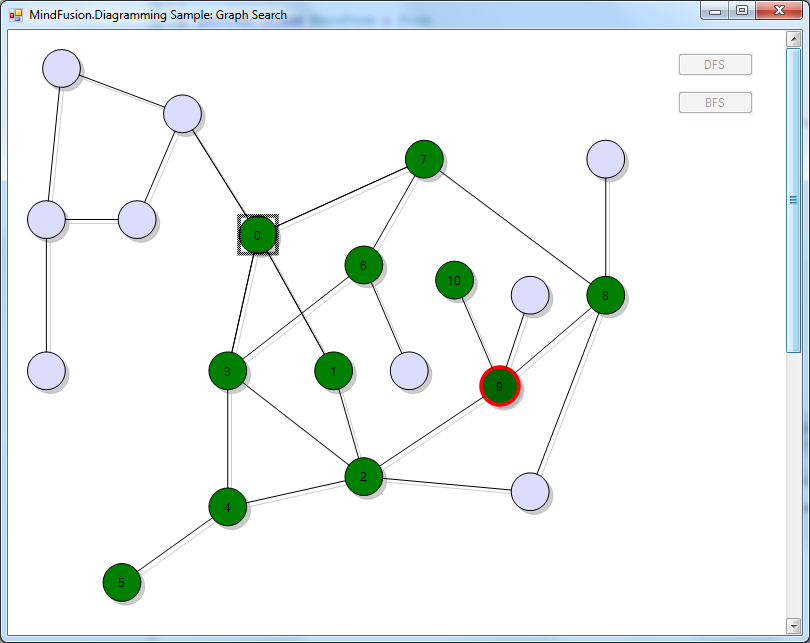
- graph traversal
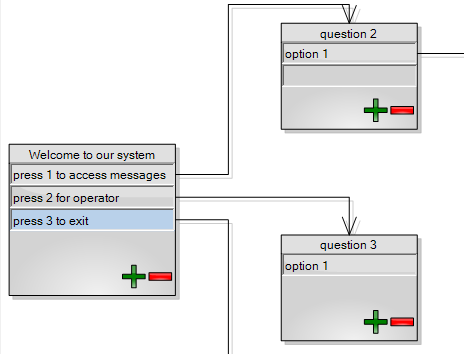
Questions or IVR messages and their possible answers / responses will be displayed respectively in caption area and cells of TableNode objects. Helper nodes at table bottom will let users add or remove rows. DiagramLink objects connecting table rows to other tables will define the dialogue flow, i.e. what next question / message to display after user selects option from current message.
Let’s start by creating a new .NET Windows Forms project. If you have installed MindFusion diagram control and selected toolbox integration from setup wizard screen, you should now see a Diagram component and DiagramView control in the toolbox. If they are not available, right click and select Choose Items, navigate to installation folder and select the mindfusion.diagramming and mindfusion.diagramming.winforms assemblies. Now drag a Diagram component to the form, and set its name to “diagram”. This automatically adds a diagramming.dll reference to the project. Drag a DiagramView (which add diagramming.winforms reference) and name it diagramView. Set its Diagram property to “diagram”, selecting it from the drop-down in property grid.
We will allow creation only of tables and links, so let’s set DiagramView.Behavior property to LinkTables. Now if users draw on the diagram canvas, the component will create TableNode if the mouse pointer is over unoccupied part of the diagram, or a DiagramLink if the mouse points a table. If we wanted to support more type of nodes, we could add their prototypes to a NodeListView instance and let users create new instances via drag-and-drop.
Add the following fields and constructor code to set up appearance and behavior of diagram elements.
public MainForm()
{
	InitializeComponent();

	// set up initial table appearance
	diagram.TableNodeStyle.Brush = new MindFusion.Drawing.SolidBrush(Color.LightGray);
	diagram.TableRowCount = 1;
	diagram.TableColumnCount = 1;
	diagram.TableCaption = "question";
	diagram.NodeEffects.Add(new GlassEffect());

	// highlight a row when clicked
	diagram.AutoHighlightRows = true;

	// find link routes automatically
	diagram.RouteLinks = true;

	// allow edit texts by double click
	diagramView.AllowInplaceEdit = true;

	// row anchor points
	rightOutput = new AnchorPattern("Right");
	rightOutput.Points.Add(new AnchorPoint(100, 50, false, true));

	// table anchor points
	input = new AnchorPattern("Input");
	input.Points.Add(new AnchorPoint(50, 0, true, false));
	input.Points.Add(new AnchorPoint(50, 100, true, true));
}

AnchorPattern rightOutput;
AnchorPattern input;
Select the diagram component in form editor and double click its NodeCreated event to add event handler. NodeCreated is raised when the user draws a new node. Add following code to associate a question / IVR message with the table, and initialize some default texts. The BeginEdit method automatically opens in-place editor to let user edit caption text immediately after drawing. We also create + and – ShapeNodes that will act as button widgets attached to the table’s bottom-right corner.
private void OnNodeCreated(object sender, MindFusion.Diagramming.NodeEventArgs e)
{
	var table = e.Node as TableNode;
	if (table != null)
	{
		int tableId = (1 + diagram.Nodes.Count / 3);
		table.Id = tableId;
		table.RowAnchorPattern = rightOutput;
		table.AnchorPattern = input;
		table.ConnectionStyle = TableConnectionStyle.Both;
		table[0, 0].Text = "option 1";
		table.Caption = "question " + tableId;
		diagramView.BeginEdit(table);

		// create + button for adding new rows
		var r = table.Bounds;
		var p = new PointF(r.Right - 14, r.Bottom - 8);
		var s = new SizeF(6, 6);
		var plus = diagram.Factory.CreateShapeNode(p, s, Shapes.Cross);
		plus.Brush = new MindFusion.Drawing.SolidBrush(Color.Green);
		plus.AttachTo(table, AttachToNode.BottomRight);
		plus.Tag = "+";

		// create - button for deleting selected row
		p.X += 7;
		p.Y += 2;
		s.Height -= 4;
		var minus = diagram.Factory.CreateShapeNode(p, s, Shapes.Rectangle);
		minus.Brush = new MindFusion.Drawing.SolidBrush(Color.Red);
		minus.AttachTo(table, AttachToNode.BottomRight);
		minus.Tag = "-";

		plus.Locked = minus.Locked = true;
		table.SubordinateGroup.AutoDeleteItems = true;
	}
}
Now add a NodeClicked handler that adds or deletes rows. If the + button is clicked, the code inserts a new row before current highlighted row. If the – button is clicked, the handler deletes current highlighted row.
private void OnNodeClicked(object sender, NodeEventArgs e)
{
	if ("+".Equals(e.Node.Tag))
	{
		var table = (TableNode)e.Node.MasterGroup.MainItem;
		if (table.HighlightedRow == -1)
			table.RowCount++;
		else
			table.InsertRow(table.HighlightedRow);
	}

	if ("-".Equals(e.Node.Tag))
	{
		var table = (TableNode)e.Node.MasterGroup.MainItem;
		if (table.HighlightedRow != -1)
			table.DeleteRow(table.HighlightedRow);
	}
}
Finally, lets create export function that will traverse the dialogue graph and export it to a custom-format XML file, which could then be passed on to a system processing the dialogues, such as IVR service.
private void btnExport_Click(object sender, EventArgs e)
{
	var fileDlg = new SaveFileDialog();
	if (fileDlg.ShowDialog() == DialogResult.OK)
	{
		var doc = new XmlDocument();
		var root = doc.CreateElement("Dialogue");
		doc.AppendChild(root);

		foreach (var node in diagram.Nodes)
		{
			var table = node as TableNode;
			if (table != null)
			{
				var questionElement = doc.CreateElement("Question");
				root.AppendChild(questionElement);

				int id = (int)table.Id;
				questionElement.SetAttribute("Id", table.Id.ToString());
				questionElement.SetAttribute("Text", table.Caption);

				for (int r = 0; r < table.Rows.Count; r++)
				{
					string answer = table[0, r].Text;
					var answerElement = doc.CreateElement("Answer");
					questionElement.AppendChild(answerElement);
					answerElement.SetAttribute("Text", answer);
					if (table.Rows[r].OutgoingLinks.Count > 0)
					{
						var link = table.Rows[r].OutgoingLinks[0];
						var nextQuestion = (TableNode)link.Destination;
						answerElement.SetAttribute("Text", answer);
						answerElement.SetAttribute("NextId", nextQuestion.Id.ToString());
					}
				}
			}
		}

		doc.Save(fileDlg.FileName);
	}
}
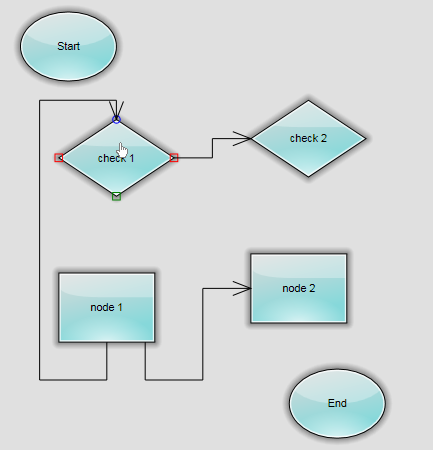
If you run the application now and draw several tables and links, you should see a similar screen:
The code above uses MindFusion’s .NET API and can be used with Windows Forms, WPF, Silverlight and ASP.NET diagramming components. The Java API for Android and desktop Swing application will look similar, with setter method calls instead of property assignments.
You can download the trial version of any MindFusion.Diagramming component from this page.
Enjoy!