We are happy to announce the new version of MindFusion.Diagramming library for Android. We have added the following new features and improvements:
AnchorPattern improvements
- The XUnit and YUnit properties allow specifying the coordinates of an AnchorPoint as a fixed offset from the node’s top-left corner rather than in percentage, so that the point position does not change when the node is resized.
- The AnchorPattern property of Shape class lets you associate anchor points with shape definitions. If a ShapeNode instance does not contain its own AnchorPattern, it will derive the one defined by the node’s Shape.
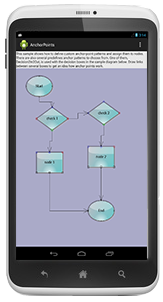
Android diagramming library: anchor points
Miscellaneous
- Links can now snap to nodes from a distance when their AutoSnapToNode property is enabled. The maximum snap distance is specified via Diagram.AutoSnapDistance property. AutoSnapToNode supersedes the old SnapToNodeBorder property, which worked only for nodes under pointer location.
- Type of Margin property of LinkLabel has been changed from float to Thickness.
- The changeUnit method sets a new MeasureUnit and scales the coordinates of diagram items to keep them the same size.
- Fixed node spacing in bottom-to-top TreeLayout.
- Multiple-resize of rotated nodes fixed to apply same offsets in nodes’ local coordinate system.
- Fixed text layout in rotated nodes.
- Improved layout of text components in CompositeNode.
The new version is available for download from the following link:
Download Diagramming for Android, V1.2
If you require technical support, please use the forum or write us at support@mindfusion.eu. A help desk is also available. Providing fast and competent technical support is among the priorities of MindFusion. We answer most support inquiries within hours of receiving them.
About Diagramming for Android: A native Java class library, which provides your Android application with a powerful set of features for creating, customizing and displaying flowcharts, genealogy trees, class hierarchies, networks, algorithms and much more. The component offers a rich choice of predefined shapes, many pen and brush options as well HTML-like formatting of text. Diagram nodes can hold text as well images, can be semi-transparent and support glass reflection effects. The component offers various automatic layout algorithms and a rich user interaction model, which supports zoom, scroll, alignment guides and more. You can read the features list of MindFusion Diagramming library for Android here. For pricing and licenses check this link.