MindFusion Pack for WPF 2013.R2

MindFusion has just released Pack for WPF 2013.R2, which adds the following new features to the components in the pack:

chartMindFusion.Charting

Bubble Chart Control

You can now create beautiful bubble charts with the new BubbleChart class. The bubble chart can hold unlimited number of BubbleSeries. The appearance of the chart is completely customizable with various properties for the pens, brushes, labels and the other visual settings of the chart.

A bubble chart in Wpf.

A bubble chart in Wpf.

3D Charts Improvements

All 3D charts derive now from a new base class – the Chart3D class. This way the control has parallel 2D and 3D chart hierarchies. The 3D chart classes support most of the properties of the 2D classes.

Hit testing in 3D has been improved. The Chart3D.HitTest method returns a ChartHitTestResult3D object, which contains information about the result of the hit-testing operation and a list of ChartElement objects available in the 2D version.

The SurfaceChart exposes a variety of new properties including CloseModelFigure, Effect3D, SurfaceType. The SurfaceType property now enables the surface chart to display its associated data as scatter marks, rather than a surface. You can customize the scatter marks through the new properties in the SurfaceSeries class – ScatterSize, ScatterType, and ShowScatterFlag.

Chart Effects

You can now create visual effects in all 2D charts with the ChartEffect property.

Miscellaneous

diagram16x16MindFusion.Diagramming

Display 3D Graphs

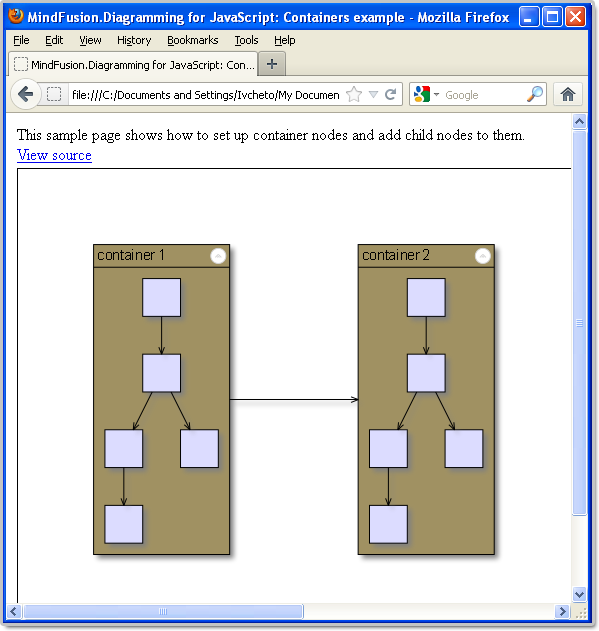
You can use the new DiagramView3D control to display the elements of a diagram in 3D space. Assign the Diagram that should be displayed in this view to the Diagram property. DiagramView3D adds a 3D model to the scene for each node or link of the specified diagram. The positions of nodes in 3D coordinate space are specified via the Position3D attached property.

The new 3D graph viewer

The new 3D graph viewer

Import of OpenOffice Draw Files

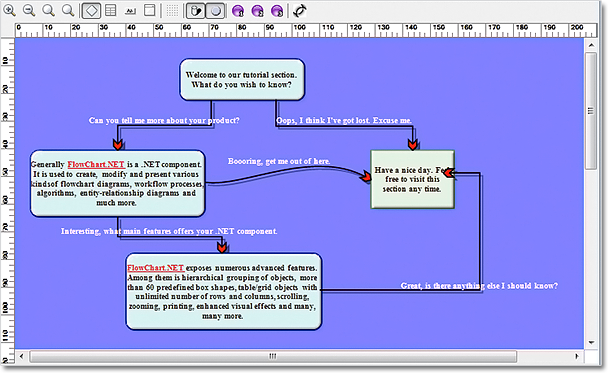
Use the new DrawImporter class to import .odg files, which you have created with the OpenOffice Draw vector graphics editor. In order to use it, you must add a reference to the MindFusion.Diagramming.Wpf.DrawImport.dll assembly. Various overloads of the Import method can be used to import the OpenOffice drawing into a DiagramDocument whose pages correspond to the Draw pages, or into a single Diagram whose content is merged from all imported pages.

Import of Visio 2003 XML drawings

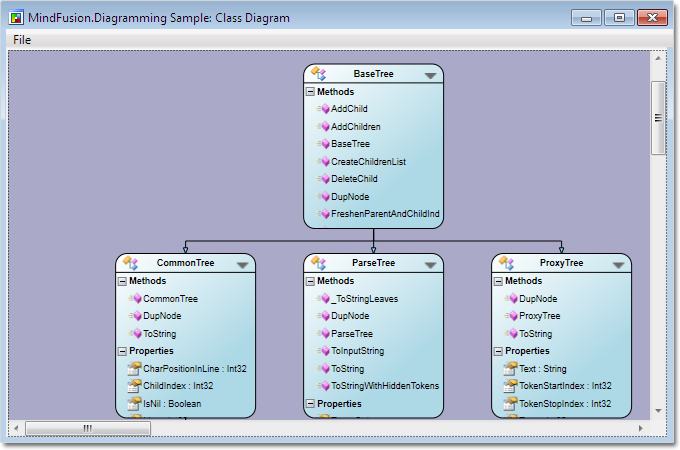
You can now import Visio 2003 XML Drawing files (*.vdx) into the Diagramming for Wpf wit the new VisioImporter. The standard Visio flowchart shapes, as well as most of the UML and Database entity shapes are imported to their closest representation in the MindFusion.Diagramming object model. The Visio connectors are imported as DiagramLink objects, preserving the relationship between the connected nodes. The Import method imports all Visio pages into a DiagramDocument, creating a DiagramPage for each page from the *.vdx file. The GetPageCount method gives you how many pages there are in a Visio document. Call the ImportPage method to import just a single page.

Miscellaneous

  • Improved appearance of hatch patterns used to draw frames for several HandlesStyle types.
  • Added support for loading HatchBrush objects from files saved by Windows Forms and ASP.NET versions of the diagramming control.
  • AttachTo overloads that attach nodes to link segments or control points now allow specifying negative index values.
  • Negative values are interpreted as relative to the last point or segment, regardless of the current number of link segments. For example, -2 denotes the second-to-last point or segment.
  • And much more.

You can find more about the new features of the components at the forum. Here is a link to download the trial version:

Download MindFusion.Pack for WPF 2013.R2

About MindFusion.Wpf Pack: A set of advanced WPF components that help you build your business application easy and on time. The tools provide you with a complete set of features to create, edit and render complex flowcharts, charts, diagrams, calendars, schedules, maps and reports. A set of gauges and UI elements is also included. Each component offers various samples, tutorials and detailed documentation. The controls offer simple and intuitive API, completely customizable appearance, numerous input/output options and a rich event set. Each tool has been thoroughly tested to guarantee that you and your application get the high quality and performance you deserve.

You can read more about the capabilities of each component at its features page:

Prices and licenses are explained in details at the buy page. We offer permanent discounts to certain types of commercial as well non commercial organizations – check here if you qualify.

MindFusion.Diagramming for JavaScript, V1.6.1

MindFusion has just released a new version of its Diagramming library for JavaScript. Here is an overview of the new features:

ContainerNode Improvements

  • Child nodes are now drawn by their containers; when containers overlap, the children of a lower container cannot appear in front of the upper container anymore.
  • The ClipChildren property specifies whether to clip child items to container’s boundaries.
  • The ZIndex property no longer changes automatically when dropping nodes into a container.
  • The Visible property of child items no longer changes when folding or unfolding containers; this lets you keep invisible items inside containers.
Container nodes in Diagramming for JavaScript.

Container nodes in Diagramming for JavaScript.

Miscellaneous

  • The LinkHitDistance property lets you specify the furthest distance from links that a click would be considered a hit.
  • The HyperLink property lets you associate an URL with diagram items.
  • EnabledHandles lets you enable or disable individual adjustment handles of nodes.
  • The arrangeLinkLabels method rearranges link labels whose AutoArrange flag is set.
Connectors in Diagramming for JavaScript

Connectors in Diagramming for JavaScript

The trial version of the new Diagramming for JavaScript release is available for direct download from the following link:

Download MindFusion.Diagramming for JavaScript Library 1.6.1

We have always taken special effort in providing quality technical support to all our clients and evaluators. You can write us at e-mail support@mindfusion.eu or use the help desk. You can use the JsDiagram section on MindFusion forum to post questions about the tool.

About Diagramming for JavaScript Library: Written 100% in JavaScript, this tool uses HTML5 Canvas to draw impressive diagrams, schemes, flowcharts, trees and many more. It is browser independent, easy to use and integrate into any web application. JsDiagram supports a variety of predefined node shapes, customizable links, rich event set and many appearance options. The user interaction model includes resizing / moving / selecting and modifying any diagram element.

The tool boasts an elegant API, which is documented in details as well numerous step-by-step guides and tutorials. Various samples are provided to let you learn quickly how to use the most important features of the library – check them here. JsDiagram is not only the perfect choice for creating any type of diagram in the browser – it can also arrange it the way you wish with a mouse click using one of its automatic graph layout algorithms. For more details about the features of the component, please visit the features page.

MindFusion.WinForms Pack, 2013.R2

MindFusion has released a new version of its pack for WinForms. Here is an overview of the new features:

chartMindFusion.Charting

Pie chart interactions

You can now resize every 2D or 3D pie chart by dragging the border between each two adjacent pieces with the mouse. The HitTestAngleOffset property lets you specify the deviation, in degrees, at which a click around the pieces border would still be considered a click on the border.

Mouse dragging in a pie chart.

Mouse dragging in a pie chart.

Support for undefined data values

You can add null (undefined) data values to all charts. The HandleEmptyValue property and the HandleEmptyValue enumeration specify the various ways null values can be handled.

ToolTips

You can now show tooltips for all chart types. In Area charts, tooltips can be displayed for every section between each two adjacent points.

Themes

Chart themes are now represented as XML files and we provide you with an initial set of 8. You can use the SaveTheme and LoadTheme methods to save/load a theme. There is also a theme editor control that lets you create, save and preview themes fast and easy.

Major/minor axis ticks

You can divide all chart axes more precisely using the new MajorTickLength and MinorTickLength properties. When their value is greater than zero, ticks are drawn not only at the axis intervals but also among them. You can customize the number of minor ticks with the MinorTicksPerInterval property.

Miscellaneous

  • Hit testing has been imrpoved in 3D cylinders and area charts
  • custom number formatting has been added to all numeric labels
  • several API changes were introduced

diagram16x16MindFusion.Diagramming

Support for Mono

You can use MindFusion.Diagramming component under the Mono runtime for OSX or Linux. A single version of the mindfusion.* assemblies can be referenced by both Mono and Microsoft .NET applications. The control detects what runtime has loaded it, and provides alternative implementations for features that are currently missing from Mono.

Custom measure units

The type of the MeasureUnit property has been changed from GraphicsUnit enum to MeasureUnit class. This class lets you define custom units by specifying their dots-per inch resolution, a string name, and number of standard divisions for display in the Ruler control. There are two new predefined units available out of the box: Centimeter and WpfPoint.

Shape control points

You can parameterize Shape formulas by associating control points with Shape objects. Each control point is passed to the shape script as a named variable. You can also specify the default, min and max coordinates for each parameter via the ShapeControlPoint constructor, and whether to treat its values as percents or fixed offset.

ContainerNode improvements

  • Child nodes are now drawn by their containers; when containers overlap, the children of a lower container cannot appear in front of the upper container anymore;
  • The ClipChildren property specifies whether to clip child items to container’s boundaries;
  • The ZIndex property no longer changes automatically when dropping nodes into a container;
Container nodes in Diagramming for WinForms

Container nodes in Diagramming for WinForms

Import OpenOffice Draw files

The DrawImporter class can import .odg files, created by the OpenOffice Draw vector graphics editor. In order to use it, you must add a reference to the MindFusion.Diagramming.Import.Draw.dll assembly. Various overloads of the Import method can be used to import the OpenOffice drawing into a DiagramDocument whose pages correspond to the Draw pages, or into a single Diagram whose content is merged from all imported pages.

PdfExporter improvements

  • Improved handling of clip regions in custom drawing code;
  • PdfExporter now honors the target Rectangle property of linear gradients;
  • PDF shadings now include all colors from a ColorBlend;

New events

  • The SetSelfLoopShape event is raised when a link becomes a self-loop, giving you a chance to set a custom shape for the link;
  • QueryAlignTarget event is raised to determine if a node should be used as alignment guide target when AutoAlignNodes is enabled;

Report-16x16 MindFusion.Reporting

Several bug fixes and improvements.

Calendar-16x16 MindFusion.Scheduling

Several new members have been added:

  • Calendar.FilterItem event
  • Calendar.SetViewport method
  • ResourceViewSettings.EnableCollisions property

You can read more details about the new features of each component at the forum. Use the link below to download the trial version of the control:

Download MindFusion.WinForms Pack 2013.R2

If you run into problems with any of the components, please let us know. We shall be glad to assist you. MindFusion is proud with its excellent technical support – the majority of the questions are answered within hours of receiving them.

About MindFusion.WinForms Pack: A set of five WinForms programming components that provide your application with a rich choice of diagramming, charting, scheduling, mapping, reporting and gauge features. The tools are very easy to implement and use. They boast intuitive API and various step-by-step tutorials to get you started. Both online and offline documentation is available. A sample browser presents you with all the samples for each control to let you easily navigate to what you need. You can check some of the features of each component right now if you look at the online demos:

Visit the features – page of the components for more information about their capabilities:

You can check the prices and licensing scheme here. All components are royalty-free.

MindFusion.Diagramming for WPF, V3.0.3

We have just released a new version of Diagramming for WPF. It contains the following new features and improvements:

Import of OpenOffice Draw files

You can use the new DrawImporter class to import *.odg files created by the OpenOffice Draw vector graphics editor. There are various downloads of the Import method, which can be used to import an OpenOffice drawing into a DiagramDocument, whose pages correspond to the Draw pages. You can also import your *.odg file into a single Diagram whose content is merged from all imported pages. Currently we support shapes from the General and Flowchart shape palettes in draw. Each shape or link is imported into a ShapeNode or DiagramLink object, whose appearance properties are set to match those of the imported shape/link as precisely as possible.

You can now import your diagrams from OpenOffice Draw files

You can now import your diagrams from OpenOffice Draw files

Display graphs in 3D

You can now display the elements of a diagram in the 3D space with the new DiagramView3D control. The control is very easy to use – just assign the Diagram to be displayed in 3D space to the Diagram property. DiagramView3D adds a 3D model to the scene for each node or link of the specified diagram. By default, nodes always face the camera, unless the NodeRotationType property is set to None.

The new 3D graph viewer

The new 3D graph viewer

Miscellaneous

  • The appearance of hatch patterns used to draw frames for several HandlesStyle types is
    improved
  • You can now load HatchBrush objects from files saved by Windows Forms and ASP.NET versions of the control.

You can download the trial version of the software from this link:

Download MindFusion.Diagramming for WPF 3.0.3

The download contains all runtime libraries of the control, various samples for different .NET versions, extensive desktop documentation and step-by-step tutorials.

If you face difficulties installing or using Diagramming for Wpf, please contact MindFusion support team per e-mail or phone. You can also use the forum or help desk. All support inquiries are answered within hours of receiving them.

About MindFusion.Diagramming for Wpf: Designed and developed to be easy to integrate, use, and customize, this native WPF component places at your disposal every single feature you would ever need to create flowcharts, diagrams, graphs, schemes, DB relationships, trees and many more. Its long list of style options gives you complete control over the appearance of the diagram. With a set of eight automatic layouts you are sure to choose the best arrangement for your items and make the diagram easy to comprehend.

The control boasts a long list of events, properties and methods for user interaction, item creation, data input and output. You can read the full features list here. The online demo shows samples that demonstrate various capabilities of the control. The licensing scheme and prices are uploaded at the buy page. Source code is also available.

Diagramming for WinForms, V6.1

MindFusion has released a new version of its Diagramming component for WinForms. It contains mostly customer requested features. Here are the details:

Support for Mono

You can use now the Diagramming component under the Mono runtime for OSX or Linux. You don’t have to use a different assembly under Mono – a single version of the mindfusion.* assemblies can be referenced by both Mono and Microsoft .NET applications. The control detects the runtime that has loaded it and provides alternative implementations for features that are currently missing from Mono.

FlowChart.NET in Mono

FlowChart.NET in Mono

Custom measure units

The type of the Diagram.MeasureUnit property has been changed from System.Drawing.GraphicsUnit enum to MindFusion.Diagramming.MeasureUnit class. This class lets you define custom units by specifying their dots-per inch resolution, a string name, and number of standard divisions for display in the Ruler control.

The Ruler control

The Ruler control

Shape control points

You can now parameterize Shape formulas by associating control points with Shape objects. Each control point is passed to the shape script as a named variable. Apart from the name, you can specify the default, min and max coordinates for each parameter, and whether to treat its values as percents or fixed offset. Here is an example:
http://mindfusion.eu/Forum/YaBB.pl?num=1376129632

API changes

A trial version of the component is available from this link:

Diagramming for WinForms, V6.1

If you have questions or run into problems using the component you can use the Diagramming for WinForms forum, the help desk or write us at support@mindfusion.eu. Our support team will be pleased to help you.

About MindFusion.Diagramming for WinForms: A programming component that provides any WinForms application with a full set of features for creating and customizing all types of diagrams, flowcharts, schemes, hierarchies, trees, graphs etc. The control provides numerous ways to save and load a diagram, six auxiliary controls and more than 10 automatic graph layout algorithms. Diagram elements include scrollable tables, container nodes, multi-segment arrows, custom diagram item types and many more. Further details here.

Diagramming for WinForms is a royalty-free component, clients get 12 month upgrade subscription when buying a license. The source code is also available for purchase. Visit the buy page for a list with the current license prices.