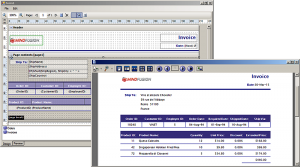
Nested DataRanges in MindFusion Report Application

In this tutorial we are going to build a report with nested data ranges. In our case, we are going to retrieve all categories from the sample Norhtwind database. For each category we will get all products in it, which is the nested data range.

I. Preparing the Project

We create a new WinForms project and add a new DataSet from the Nortwind database. We choose all fields from the Categories and Products tables. Then we add a new item from the menu “Project -> Add -> New Item -> MindFusion Report” from the dialog that appears.

Adding the MindFusion Report item.

Adding the MindFusion Report item.

Drag and drop the nwindDataSet, CategoriesTableAdapter and ProductsTableAdapter on the report form. Finally, in the code behind fill the two adapters:

 productsTableAdapter1.Fill(nwindDataSet1.Products);
 categoriesTableAdapter1.Fill(nwindDataSet1.Categories); 

II. The Categories DataRange

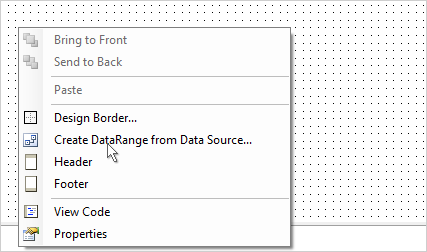
We create the first data range by right clicking on the newly created report. There we see “Create Data Range from Data Source”. We choose the categories table and two fields – CategoryName and Picture. When the data range is generated we resize the picture to make it bigger.

Create DataRange context menu.

Create DataRange context menu.

III. Running the Report

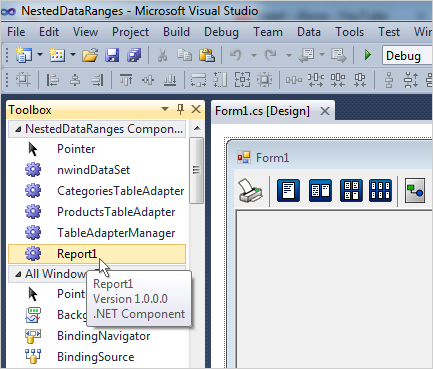
We would use MindFusion ReportViewer to preview what we’ve done so far. We drag it from the Toolbox and place it on the form, which shows when the application runs. We compile the project and see that the Report1 class that we’ve created appears in the Toolbox, under the Data tab. This means we can create instances of our report just by drag and drop. We drag the Report1 icon and drop it on Form1. We have a report11 instance, which we assign to the Report property of the ReportView in the property grid.

Dragging the Report1 item.

Dragging the Report1 item.

Finally, we run the report:

report11.Run();

IV. The Nested DataRange

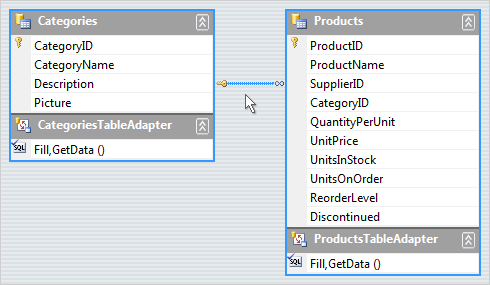
It’s time to create the second DataRange. We right-click the Report1 form and choose again “Create DataRange from Data Source.” This time we choose the Products table and we choose ProductName, UnitsInStock and UnitPrice fields. This time we check the “Generate Header” checkbox at the bottom. The second DataRange is ready. Nesting it is very easy. We resize the first DataRange to make it wider and just drag and drop the second DataRange in it. What is important is to set the MasterDetailRelation property. It must be the name of the relation between the two tables that provide data for the two DataRange-s. We can see it by clicking on the nwindDataSet -> “Edit DataSet with Designer. There we click on the relation between or two tables and see it is called “CategoriesProducts”. We place this name as a value to the MasterDetailRelation property.

Master detail relationship between the Products and Categories table.

Master detail relationship between the Products and Categories table.

V. Run the report

We run the report and see that everything is in place: the categories are listed with their picture, each category lists all its products.

VI. Style Adjustments

Finally let’s add some appearance optimizations that will make the report look better and thus be easier to read. First, we make the background of the Category label darker.

Then we make the product lines with alternating colors. This is done in the property grid for the dataRange2 object -> AlternatingBackground property.

We add a light gray border to the first data range with the Border property editor and we add a bottom margin of 30 mm. Here is the final look of the report:

Nested DataRange-s: the final report.

Nested DataRange-s: the final report.

You can download the sample from this link:

Download Nested DataRanges MindFusion Reporting Sample

More about MindFusion Reporting for WinForms component can be found here.

MindFusion.Reporting for WinForms, V2.3 Is Released

MindFusion is happy to announce the new release of its WinForms reporting control. Here is an overview of the new features:

Support for Visual Studio 2015

MindFusion.Reporting now supports Visual Studio 2015 as well. You can tell the installer to create VS2015 toolbox palette for the component.

Licensing

There is no separate trial build of the control assemblies anymore. Instead, you must set the LicenseKey property of the component to disable the evaluation mode and stop displaying trial messages. If your application contains more than one control by MindFusion, you can call MindFusion.Licensing.LicenseManager.AddLicense(key) to specify the key once instead of setting it per each control. License key strings are listed on the Keys & Downloads page at MindFusion’s customer portal.

Barcodes

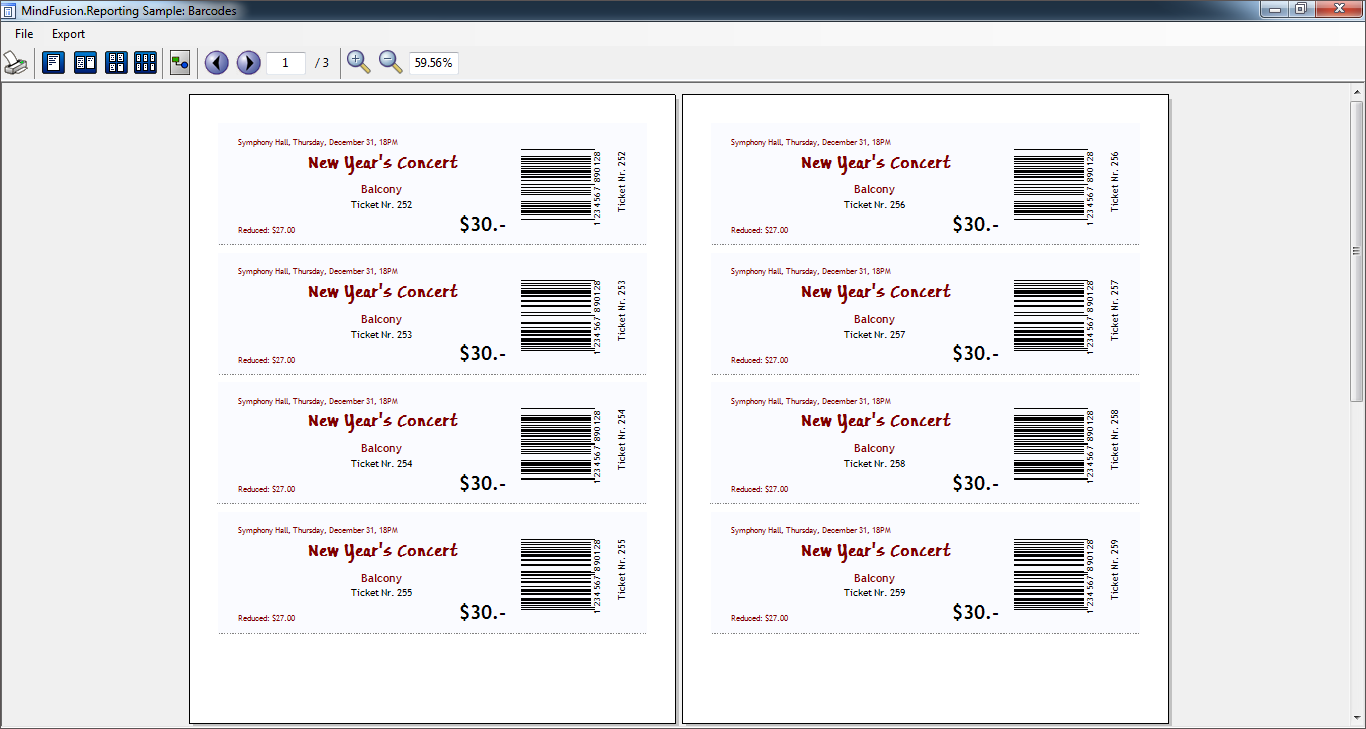
Use the new Barcode report item to display UPC-A, UPC-E, EAN-8, EAN-13, and QR barcodes in your WinForm reports. A new sample demonstrates how to implement the feature.

MindFusion WinForms Reporter: Bar Codes

MindFusion WinForms Reporter: Bar Codes

The component is available for direct download from here:

Download MindFusion Reporter for WinForms, V2.3

Don’t forget that the reporting tool is also available on Nuget. To install the component, run the following command in the Package Manager Console:

PM> Install-Package MindFusion.Reporting

Additional information about the library can be found in the online documentation:
http://www.mindfusion.eu/onlinehelp/mindfusionreporting/index.htm

Technical support is available at the Reporting for WinForms section of MindFusion discussion board, at the Help Desk or per e-mail at support@mindfusion.eu. Either way, MindFusion competent and friendly support team is pleased to assist you with any questions or inquiries you might have about the product.

About Reporting for WinForms: Enhance your business application with the complete set of features to create impressive, user-friendly reports that present important data in an easy-to comprehend look. Enjoy the rich report design capabilities that let you integrate charts, customize fonts and use easy WinForms component as a report item.
Bind our report to any .NET data source or work in an unbound mode. Choose among various output options among which XML, PDF and HTML files. Get inspired, get moving – MindFusion Reporting for WinForms is designed and developed to help you acheive best possible results in little time and with little effort. Read more about the tool here…

Creating a proprietary invoice editor

In this post we will show how to create an invoice editing application (using MindFusion.Reporting) for the end users of an organization. The source code of the sample is available for download from here:

https://mindfusion.eu/_samples/ReportingInvoiceEditor.zip

Introduction
We start off by creating a new Windows Forms Application in Visual Studio 2010 or later. Change the target framework of the application to “.NET Framework 4” (or later). The ReportEditor component that will be used as an in-place invoice editor requires at least .NET 4.

Add the ReportEditor component to the main form, set its Dock to Fill.

The invoice template
The invoice template displayed by the application is stored in an XML file. The original template is created beforehand and is located in Invoice.xml. All modifications to the template done by the end users will be stored back to the XML file upon exiting the application. Add the following line to the main form’s constructor to load the invoice template when the main form is constructed:

reportEditor1.OpenReport(@"Invoice.xml");

Adding the data source
From the “Data -> Add New Data Source…” menu in Visual Studio create a new data source from the nwind.mdb database. Select the Orders table and the Invoices query in the Data Source Configuration Wizard. In the XML Schema (nwindDataSet.xsd) ensure that there is a relation between the Orders and Invoices table adapters. The relation should link the OrderID fields of the two tables and should be named “Orders_Invoices”. Build the application so that Visual Studio creates the classes for the data set and the selected table adapters. Go back to the main form designer and add nwindDataSet, InvoicesTableAdapter, and OrdersTableAdapter components to the form. In the constructor of the form, add the following lines in order to fill the data set with the data from the source database:

invoicesTableAdapter1.Fill(nwindDataSet1.Invoices);
ordersTableAdapter1.Fill(nwindDataSet1.Orders);

In addition, we need to register the two tables as data sources in the report editor. This is essential because these data sources are used by the invoice report. It is also important that the data sources are registered before the report is initially loaded through the OpenReport method.

reportEditor1.AddDataSource(nwindDataSet1.Orders, "Orders");
reportEditor1.AddDataSource(nwindDataSet1.Invoices, "Invoices");

Saving the template
Override the OnClosing event of the form and add the following line to ensure that all changes to the invoice template are written back to the XML file:

reportEditor1.SaveReport(@"Invoice.xml");

Adding the menu
Create a menu strip for the application with the following structure:

  • File
    • Print
    • Print Preview
    • Exit
  • Edit
    • Undo
    • Redo

Add the following event handlers for the menu items:

private void printToolStripMenuItem_Click(object sender, EventArgs e)
{
	var printer = new ReportPrinter();
	printer.Report = reportEditor1.Report;
	printer.Report.Run();
	printer.Print();
}

private void printPreviewToolStripMenuItem_Click(object sender, EventArgs e)
{
	var printer = new ReportPrinter();
	printer.Report = reportEditor1.Report;
	printer.Report.Run();

	var preview = new PrintPreviewForm();
	preview.Document = printer;
	preview.ShowDialog();
}

private void exitToolStripMenuItem_Click(object sender, EventArgs e)
{
	Close();
}

private void undoToolStripMenuItem_Click(object sender, EventArgs e)
{
	reportEditor1.Undo();
}

private void redoToolStripMenuItem_Click(object sender, EventArgs e)
{
	reportEditor1.Redo();
}

The image below illustrates the running application:

reporting-invoiceeditor

The MindFusion.Reporting component can be downloaded from here:

https://www.mindfusion.eu/ReportingTrial.zip

Enjoy!

MindFusion Controls on NuGet

All MindFusion components for WinForms, WPF and Silverlight are now available as NuGet packages. The following table lists the NuGet IDs of the individual products:

Product NuGet ID
MindFusion.Charting for WinForms
MindFusion.Diagramming for WinForms
MindFusion.Gauges for WinForms
MindFusion.Pack for WinForms
MindFusion.Reporting for WinForms
MindFusion.Scheduling for WinForms
MindFusion.Spreadsheet for WinForms
MindFusion.Charting
MindFusion.Diagramming
MindFusion.Gauges
MindFusion.Pack
MindFusion.Reporting
MindFusion.Scheduling
MindFusion.Spreadsheet
MindFusion.Charting for WPF
MindFusion.Diagramming for WPF
MindFusion.Gauges for WPF
MindFusion.Pack for WPF
MindFusion.Reporting for WPF
MindFusion.Scheduling for WPF
MindFusion.Spreadsheet for WPF
MindFusion.Charting.Wpf
MindFusion.Diagramming.Wpf
MindFusion.Gauges.Wpf
MindFusion.Pack.Wpf
MindFusion.Reporting.Wpf
MindFusion.Scheduling.Wpf
MindFusion.Spreadsheet.Wpf
MindFusion.Charting for Silverlight
MindFusion.Diagramming for Silverlight
MindFusion.Gauges for Silverlight
MindFusion.Pack for Silverlight
MindFusion.Reporting for Silverlight
MindFusion.Scheduling for Silverlight
MindFusion.Charting.Silverlight
MindFusion.Diagramming.Silverlight
MindFusion.Gauges.Silverlight
MindFusion.Pack.Silverlight
MindFusion.Reporting.Silverlight
MindFusion.Scheduling.Silverlight

The complete list of MindFusion products on NuGet can be found here: https://www.nuget.org/profiles/MindFusion.

The NuGet manager is available for Visual Studio 2010, Visual Studio 2012, and Visual Studio 2013 and can be downloaded from here: https://www.nuget.org/.

To install a package, run the following command in the Package Manager Console (accessible from the Visual Studio menu: Tools → NuGet Package Manager → Package Manager Console):

PM> Install-Package 

Where <id> is the NuGet ID of the package. For example, to install MindFusion.Diagramming for WinForms, use:

PM> Install-Package MindFusion.Diagramming

Enjoy!

Custom items in Silverlight reports

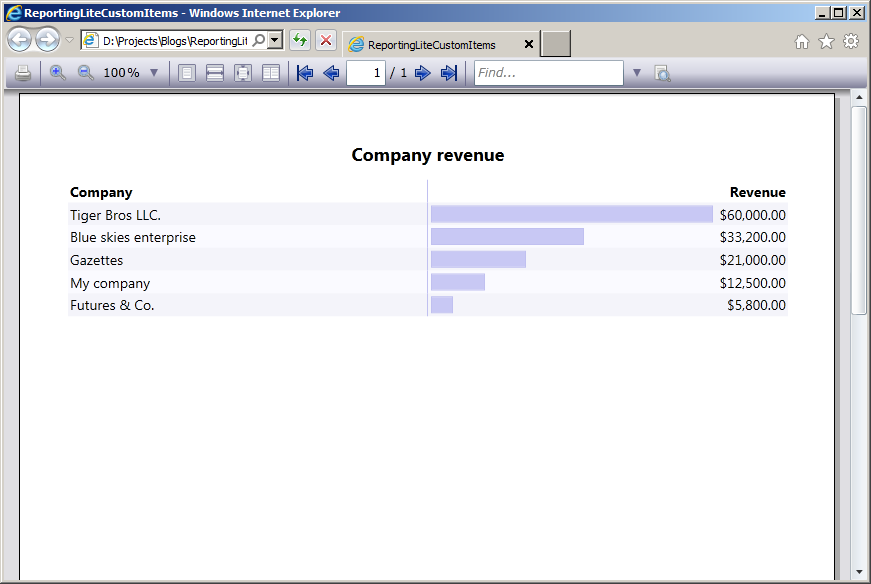
In this post we will examine how to use custom items in MindFusion reports in Silverlight. The report in question will display the revenue of several companies, sorted in descending order. The custom items will visualize the relative revenue value of each company as a graphics similar to a chart.

To start off, we will define our business objects – a CompanyInfo class with two properties – Name and Revenue, of type string and double respectively.

public class CompanyInfo
{
  public string Name { get; set; }
  public double Revenue { get; set; }
}

Then we will declare sample data – an array of several companies, sorted by revenue:

var companyInfo = new CompanyInfo[]
{
  new CompanyInfo { Name = "My company", Revenue = 12500 },
  new CompanyInfo { Name = "Blue skies enterprise", Revenue = 33200 },
  new CompanyInfo { Name = "Futures & Co.", Revenue = 5800 },
  new CompanyInfo { Name = "Gazettes", Revenue = 21000 },
  new CompanyInfo { Name = "Tiger Bros LLC.", Revenue = 60000 },
}.OrderByDescending(info => info.Revenue);

The actual report is placed inside Resource Dictionary (named MyReport.xaml). The report contains a title and a single data range with three columns – for company name, revenue graphics and revenue value respectively. The actual report is omitted for brevity, but the code of the custom item representing the revenue graphics is shown below:

<report:CustomReportItem Location="50%,0" Size="40%,6" Value="[100*Revenue/Max(&quot;Revenue&quot;)]">
  <report:CustomReportItem.Template>
    <DataTemplate>
      <Grid>
        <Grid.ColumnDefinitions>
          <ColumnDefinition Width="{Binding Converter={StaticResource gridLengthConverter}}" />
          <ColumnDefinition Width="{Binding Converter={StaticResource gridLengthConverter}, ConverterParameter='-'}" />
        <ColumnDefinition />
        <Border BorderBrush="#C0C0F0" BorderThickness="1" Background="#C8C8F4" Margin="3" />
      </Grid>
    </DataTemplate>
  </report:CustomReportItem.Template>
</report:CustomReportItem>

The value of the custom item is calculated as the percentage of the company revenue relative to the maximum revenue amongst all companies. The content of the custom item represents a grid with two columns. The first column contains the border that is used as the representation of the revenue graphics. The width of the columns is calculated according to the item value by using a custom value converter – GridLengthConverter. The GridLengthConverter basically converts the value to a GridLength object with GridUnitType set to Star.

The report is loaded from the resource dictionary using the helper Report.FromDictionary method, then setup with the data and run:

var report = Report.FromDictionary(new Uri("ReportingLiteCustomItems;component/MyReport.xaml", UriKind.Relative), "myReport");
report.DataContext = companyInfo;
report.QueryDetails += (s, e) => e.Details = companyInfo;
report.Run()

Note, that the sample handles the QueryDetails event. This is done in order to supply data to the Max aggregate function used inside the CustomReportItem.Value expression.

Finally, the report is selected inside a ReportViewer on the main form:

viewer.Document = report;

The following image shows the running sample:

The source code is available for download from here:

Download the Complete Source Code for the Sample

You can get the trial version of MindFusion.Reporting for Silverlight from this link:

Download MindFusion.Reporting for Silverlight Trial Version