MindFusion has released a new version of its pack for WinForms. Here is an overview of the new features:
 MindFusion.Charting
Pie chart interactions
You can now resize every 2D or 3D pie chart by dragging the border between each two adjacent pieces with the mouse. The HitTestAngleOffset property lets you specify the deviation, in degrees, at which a click around the pieces border would still be considered a click on the border.

Mouse dragging in a pie chart.
Support for undefined data values
You can add null (undefined) data values to all charts. The HandleEmptyValue property and the HandleEmptyValue enumeration specify the various ways null values can be handled.
ToolTips
You can now show tooltips for all chart types. In Area charts, tooltips can be displayed for every section between each two adjacent points.
Themes
Chart themes are now represented as XML files and we provide you with an initial set of 8. You can use the SaveTheme and LoadTheme methods to save/load a theme. There is also a theme editor control that lets you create, save and preview themes fast and easy.
Major/minor axis ticks
You can divide all chart axes more precisely using the new MajorTickLength and MinorTickLength properties. When their value is greater than zero, ticks are drawn not only at the axis intervals but also among them. You can customize the number of minor ticks with the MinorTicksPerInterval property.
Miscellaneous
- Hit testing has been imrpoved in 3D cylinders and area charts
- custom number formatting has been added to all numeric labels
- several API changes were introduced
 MindFusion.Diagramming
Support for Mono
You can use MindFusion.Diagramming component under the Mono runtime for OSX or Linux. A single version of the mindfusion.* assemblies can be referenced by both Mono and Microsoft .NET applications. The control detects what runtime has loaded it, and provides alternative implementations for features that are currently missing from Mono.
Custom measure units
The type of the MeasureUnit property has been changed from GraphicsUnit enum to MeasureUnit class. This class lets you define custom units by specifying their dots-per inch resolution, a string name, and number of standard divisions for display in the Ruler control. There are two new predefined units available out of the box: Centimeter and WpfPoint.
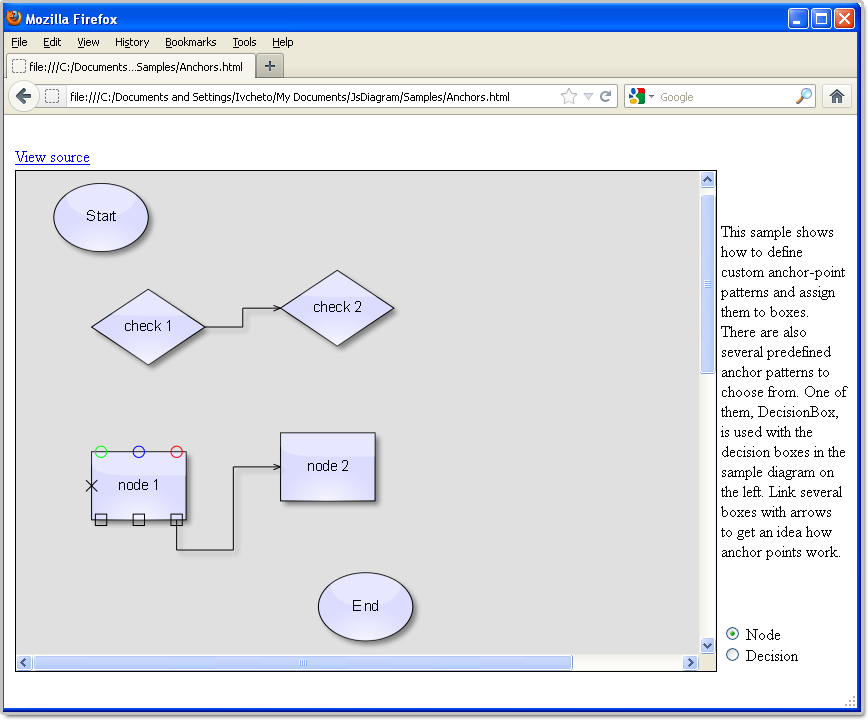
Shape control points
You can parameterize Shape formulas by associating control points with Shape objects. Each control point is passed to the shape script as a named variable. You can also specify the default, min and max coordinates for each parameter via the ShapeControlPoint constructor, and whether to treat its values as percents or fixed offset.
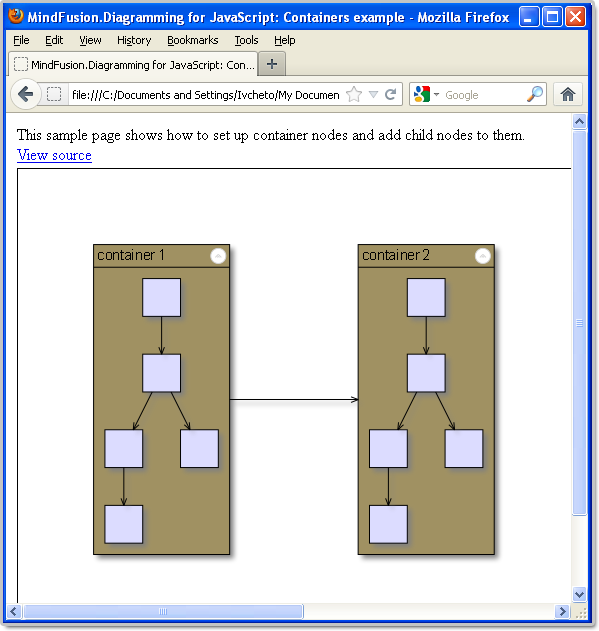
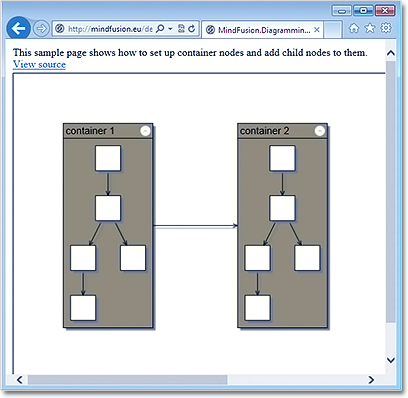
ContainerNode improvements
- Child nodes are now drawn by their containers; when containers overlap, the children of a lower container cannot appear in front of the upper container anymore;
- The ClipChildren property specifies whether to clip child items to container’s boundaries;
- The ZIndex property no longer changes automatically when dropping nodes into a container;

Container nodes in Diagramming for WinForms
Import OpenOffice Draw files
The DrawImporter class can import .odg files, created by the OpenOffice Draw vector graphics editor. In order to use it, you must add a reference to the MindFusion.Diagramming.Import.Draw.dll assembly. Various overloads of the Import method can be used to import the OpenOffice drawing into a DiagramDocument whose pages correspond to the Draw pages, or into a single Diagram whose content is merged from all imported pages.
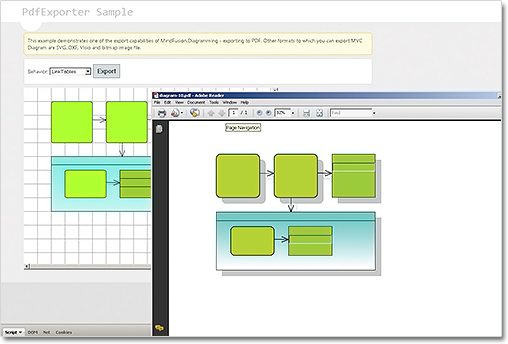
PdfExporter improvements
- Improved handling of clip regions in custom drawing code;
- PdfExporter now honors the target Rectangle property of linear gradients;
- PDF shadings now include all colors from a ColorBlend;
New events
- The SetSelfLoopShape event is raised when a link becomes a self-loop, giving you a chance to set a custom shape for the link;
- QueryAlignTarget event is raised to determine if a node should be used as alignment guide target when AutoAlignNodes is enabled;
 MindFusion.Reporting
Several bug fixes and improvements.
 MindFusion.Scheduling
Several new members have been added:
- Calendar.FilterItem event
- Calendar.SetViewport method
- ResourceViewSettings.EnableCollisions property
You can read more details about the new features of each component at the forum. Use the link below to download the trial version of the control:
Download MindFusion.WinForms Pack 2013.R2
If you run into problems with any of the components, please let us know. We shall be glad to assist you. MindFusion is proud with its excellent technical support – the majority of the questions are answered within hours of receiving them.
About MindFusion.WinForms Pack: A set of five WinForms programming components that provide your application with a rich choice of diagramming, charting, scheduling, mapping, reporting and gauge features. The tools are very easy to implement and use. They boast intuitive API and various step-by-step tutorials to get you started. Both online and offline documentation is available. A sample browser presents you with all the samples for each control to let you easily navigate to what you need. You can check some of the features of each component right now if you look at the online demos:
Visit the features – page of the components for more information about their capabilities:
You can check the prices and licensing scheme here. All components are royalty-free.