Create a block diagram editor in JavaScript

In this example, we will create a block diagram editor using MindFusion.Diagramming for JavaScript.

First, let’s add two HTML canvas elements to a page, one for the Diagram control and one for a NodeListView control that will serve as a tool palette:

<!-- The Diagram component is bound to the canvas element below -->

<div style="width:800px; height:600px; overflow:auto; border: 1px solid;">
  <canvas id="diagram" width="2100" height="2100">
    This page requires a browser that supports HTML 5 Canvas element.
  </canvas>
</div>


<!-- NodeListView control -->

<div style="width:130px; height:600px; overflow:none; border: 1px solid rgb(0, 0, 0);">
  <canvas id="nodeList" width="130" height="600"></canvas>
</div>

Next, add references to the necessary script files:

<script src="MicrosoftAjax.js" type="text/javascript"></script>
<script src="MindFusion.Diagramming.js" type="text/javascript"></script>
<script src="BlockDiagEdit.js" type="text/javascript"></script>

In the load handler in the script file, setup the diagram properties and populate the node list with prototype containers and shape nodes, that will represent respectively systems and modules in our block diagrams:

Sys.Application.add_load(function (sender, args)
{
	// create a Diagram component that wraps the "diagram" canvas
	diagram = $create(Diagram, null, null, null, $get("diagram"));
	diagram.addEventListener(Events.nodeCreated, onNodeCreated);
	diagram.addEventListener(Events.linkCreated, onLinkCreated);
	diagram.setLinkHeadShapeSize(3);
	diagram.setLinkHeadShape("Alternative");
	diagram.setAllowInplaceEdit(true);

	// create a NodeListView component that wraps the "nodeList" canvas
	var nodeList = $create(MindFusion.Diagramming.NodeListView,
        null, null, null, $get("nodeList"));
	nodeList.setIconSize(new Size(48, 48));
	nodeList.setDefaultNodeSize(new Size(24, 24));

	var colors = [
		"#FF5555",
		"#55FF55",
		"#5555FF",
		"#FFFFFF"
	];

	// add container to the NodeListView to represent "system" blocks
	for (var i = 0; i < 4; ++i)
	{
		var node = new ContainerNode(diagram);
		node.setBrush(colors[i]);
		nodeList.addNode(node, "System " + (i + 1));
	}

	// add container to the NodeListView to represent "module" blocks
	for (var i = 0; i < 4; ++i)
	{
		var node = new MindFusion.Diagramming.ShapeNode(diagram);
		node.setShape("Rectangle");
		node.setBrush(colors[i]);
		nodeList.addNode(node, "Module " + (i + 1));
	}
});

Handle the nodeCreated event to make containers larger, and start inplace edit operation to let users enter text immediately after dropping a node:

function onNodeCreated(sender, args)
{
	var node = args.getNode();
	if (ContainerNode.isInstanceOfType(node))
	{
		// make containers larger
		var bounds = node.getBounds().clone();
		bounds.width = 100;
		bounds.height = 75;
		node.setBounds(bounds);
	}

	// let user enter text immediately
	diagram.beginEdit(node);
}

When there aren’t anchor points defined, the diagram control snaps link points to nearest point of nodes borders. Let’s automatically align points when links are created to make them straight horizontal or vertical lines if they are already close to being such. Otherwise leave points unchanged to let users draw diagonal lines too:

function onLinkCreated(sender, args)
{
	var link = args.getLink();
	var start = link.getStartPoint();
	var end = link.getEndPoint();

	// make link horizontal if close to being one
	if (Math.abs(start.x - end.x) > 10 && Math.abs(start.y - end.y) < 4)
	{
		end.y = start.y;
		link.setEndPoint(end);
	}

	// make link vertical if close to being one
	if (Math.abs(start.y - end.y) > 10 && Math.abs(start.x - end.x) < 4)
	{
		end.x = start.x;
		link.setEndPoint(end);
	}
}

Here’s the kind of block diagrams and flowcharts you can now draw:
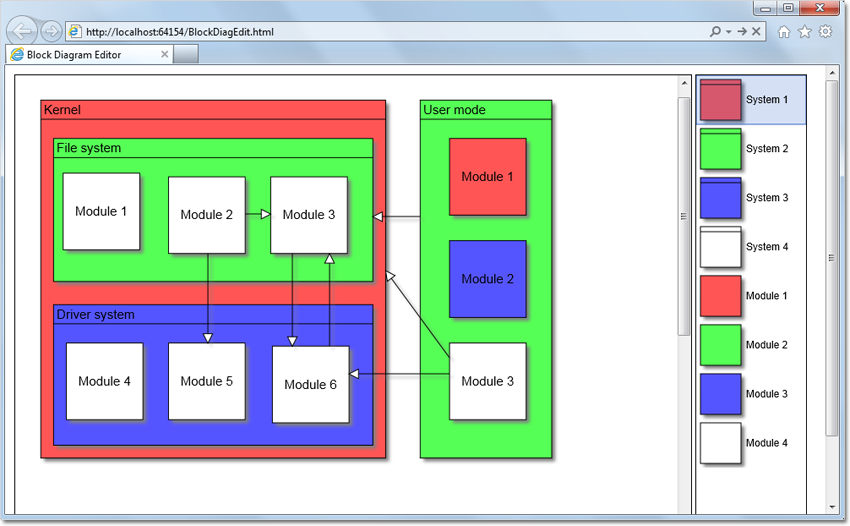
Block diagram

The complete example can be downloaded from this link:
https://mindfusion.eu/_samples/BlockDiagEdit.zip

Enjoy!

Diagramming for ASP.NET 5.0

MindFusion has released a new version of its Diagramming for ASP.NET component. There are many new features for customizing the appearance, a new layout and a few enhancements. Here are the details:

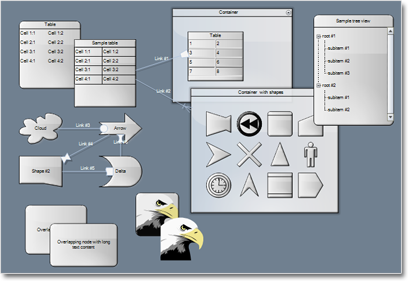
Styles & Themes

You can apply now styles to change the appearance of the diagram items. Each style is a set
of properties, which can be applied to a given diagram item (with the DiagramItem.Style
property) or to all items of a specific type (by using a Theme). The theme is a collection of
styles. Each style in the theme sets the appearance of all items of a specific type. Themes
can be loaded from XML files.

The Slate Theme

The Slate Theme

Node effects
(n.a. in Canvas mode)

Two visual effects – the GlassEffect and the AeroEffect can be applied to nodes. Effects can
be added, removed or modified at any time and this reflects immediately on the diagram. You
can apply effects of different types simultaneously.

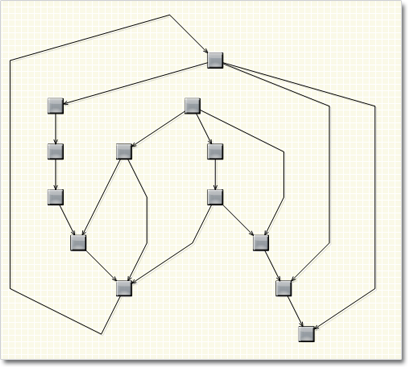
One way graph layout

This layout ensure that links enter into nodes from the same general direction and exit from
the opposite side. If the graph contains cycles some links bend around the nodes to keep the
enter/exit direction consistent. The algorithm aims to minimize the number of such links.

one_way_layout1

The One Way Graph Layout

Enhancements in Canvas mode

  • Items can cast shadows
  • Items can be Locked
  • Containers are available in Canvas mode
  • Tables are available in Canvas mode
  • Tooltips for items
  • and more

Enhancements in ImageMap mode

  • Items can be Locked
  • Interactive rotation of nodes
  • ImageFormat property added to ShapeListBox
  • and more

Multiple Labels per Link
(n.a. in Canvas mode)
The LinkLabels class allows multiple captions to be displayed for a single DiagramLink instance.
Link labels provide a set of properties that allow full customization of their location and
appearance. Labels support automatic arrangement to avoid overlapping nodes or other
labels.

Layers
(n.a. in Canvas mode)
Items can be assigned to layers and layers can be hidden, locked or moved up/down in the
Z-order or as a group. Use the LayerIndex property to associate and item with a layer in the
Diagram.Layers collection. Each layer has Visible, Locked and ZIndex properties, which affect
all items in the layer.

Parallel Layouts
The .NET 4 version of Diagramming for ASP.NET takes advantage of the Task Parallel Library
to enable parallelism on the different layout algorithms. Set the EnableParallelism property of
the Layout class to true to enable arranging different sub graphs on different threads to
improve performance on multiprocessor systems.

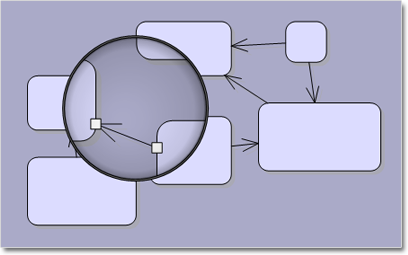
Magnifier
(in Java and Silverlight modes)
The new magnifier tool allows user to interactively zoom in or zoom out portions of the
diagram by holding down a magnifier tree or pressing a mouse button. The magnifier’s
appearance and zoom factor can be customized.

The Magnifier Tool

The Magnifier Tool

API changes
A variety of changes have been made to the API of the control to keep it elegant and simple – please consult the “What’s new section” in the online documentation.

Detailed information about the release is posted at the forum. The trial version is available for direct download from the link below:

Download MindFusion.Diagramming for ASP.NET 5.0

About Diagramming for ASP.NET: An advanced WebForms programming component that offers all the functionality that is needed for creating, styling and presenting attractive flowcharts, hierarchies, trees, graphs, schemes, diagrams and many more. The control offers numerous utility methods, path finding and cycle detection, rich event set and many useful user interaction features like tool tips, multiple selection, copy/paste to/from Windows clipboard and many more.

NetDiagram offers 87 predefined node shapes, scrollable tables, 13 automatic layouts and many more. You can check the online demo to see some of the features in action. The control includes many samples, detailed documentation and step-by-step tutorials. Every features is duly documented and there’s plenty of code to copy. We have done our best to make the component not only powerful and scalable, but easy to learn and fun to use.