Line Chart With Multiple Axes in WPF

A common scenario when building charts is the ability to render multiple series bound to multiple axes, each one with its own scale. To deal with this issue, MindFusion.Charting for WPF control has added support for multiple axes of all types – X, Y, Y2, X2 and in this post we’ll look how to add and customize them and how to create series bound to a given axis.

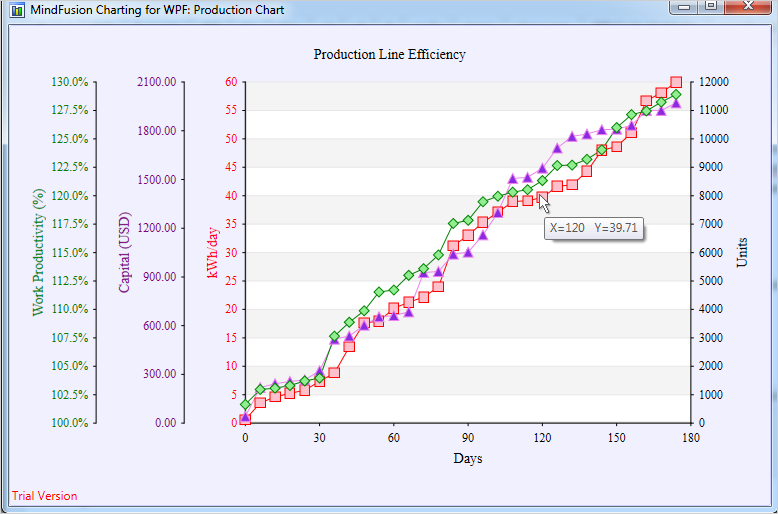
The sample imitates a production chart, where three different scales measure three different values – work output, capital and energy consumption – all of which presumably participate in producing a single unit of a product. On the right side we have a single Y2 axis, which measures the amount of units produced. The X-axis displays the time scale. Let’s look at the chart elements, one by one.

I. The Y-Axes

The Y-axes, as all axes in the chart are an instance of the Axis class and are added to the appropriate collection property. The Axis class defines all types of useful properties needed to customize an axis. We define the three axes in XAML:

<chart:linechart.yaxes>
    <chart:axescollection>
        <chart:axis minvalue="0" interval="5" maxvalue="60" labelformat="F0" tick="3" title="kWh/day" titlerotationangle="270" labelstroke="Red" titlestroke="Red"></chart:axis>
        <chart:axis minvalue="0" interval="300" maxvalue="2100" title="Capital (USD)" tick="3" titlerotationangle="270" labelstroke="Purple" titlestroke="Purple"></chart:axis>
        <chart:axis minvalue="100" interval="2.5" maxvalue="130" title="Work Productivity (%)" customlabelposition="AutoScalePoints" axiscrossingpoint="100.0" labeltype="CustomText" tick="3" titlerotationangle="270" labelstroke="Green" titlestroke="Green"></chart:axis>
    </chart:axescollection>
</chart:linechart.yaxes>

The property names easily describe what is set: the minimum and maximum values on each of the three axes, the title, the stroke for the labels and the title, the interval and the length of the axis ticks. Let’s note that the type of labels for the last Y-axis is “CustomText” – this means we will specify the labels explicitly rather than allow the control to generate them as with the other two axes – they don’t set a label type and the default value (the auto scale) is rendered.

Here is how we define the labels:

double start = 100.0;

    //130 is the last number at the axis
    while (start <= 130)
    {
        string l = start.ToString("F1") + "%";
        chart.YAxes[2].Labels.Add(l);
        start += 2.5;
    }

II. The Y2 Axis

The Y2-axis is just one and it is entirely declared in XAML:

<chart:linechart.y2axes>
    <chart:axescollection>
        <chart:axis minvalue="0" interval="1000" maxvalue="12000" tick="3" labelformat="F0" titlerotationangle="270" title="Units"></chart:axis>
     </chart:axescollection>
</chart:linechart.y2axes>

The label format is set with the standard .NET numeric strings – in this case it is a floating number without trailing zeros. In this axis, as well in the other Y-axes you might have noticed that we use the TitleRotationAngle property. This property rotates the title label at an arbitrary angle between 0 and 360. In our case we want the label drawn vertically, to conserve space.

III. The Series

The series are created in code. They specify scatter type because we want each series to have markers at data points. The YAxis property specifies the Y-axis, which a given Series is bound to. Finally, we specify the tool tip type because we want to have a tool tip when the mouse hovers a data point.

 LineSeries series0 = new LineSeries();
 series0.YAxis = chart.YAxes[0];
 series0.ScatterType = ScatterType.Square;
 series0.ScatterFills = new BrushCollection() { Brushes.Pink };
 series0.ScatterStrokes = new BrushCollection() { Brushes.Red };
 series0.Strokes = new BrushCollection() { Brushes.Red };
 series0.ToolTipType = ToolTipType.ChartData;

The data is random generated numbers. We use the Axis.XData and Axis.YData properties to set it.

 for (int i = 0; i < 30; i++)
     {
        series0.XData.Add(i * 6);
        data1.Add(rand.NextDouble() * 60.0);     
      }

      data1.Sort();
      series0.YData = new DoubleCollection(data1);
      //don't forget to add the series
      chart.Series.Add(series0);

Last but not least – don’t forget to add the series to the Series collection property of the chart. With that our chart is ready – here is the result:

Charting for WPF: Multiple Axes and Series

Charting for WPF: Multiple Axes and Series

You can download the sample with the chart libraries from here:

WPF Chart With Multiple Axes Sample Download

If you have any questions regarding the chart component use the forum, email or the help desk to contact MindFusion. More information about Charting for WPF, which includes a premium 3D charting library and a Real time charting library optimized to handle huge data sets can be found here.

Scatter Line Chart in WinForms with a Custom Legend

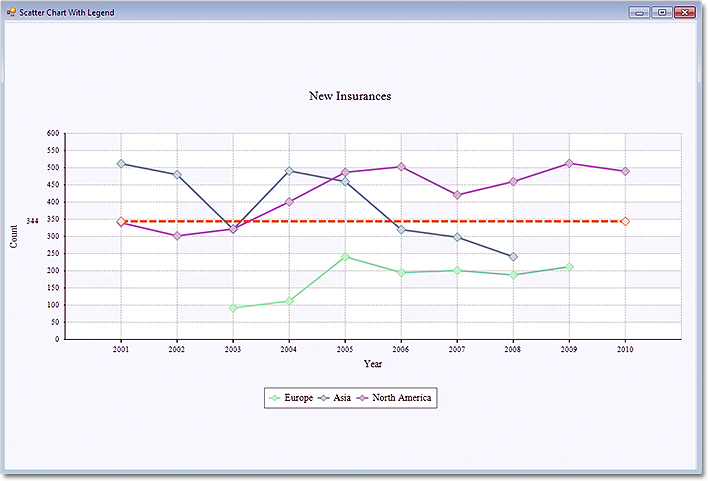
In this post we show you how to build a multi-series scatter chart with a legend and a separator. We use MindFusion.Charting tool for WinForms.

The Data

The properties that specify data in the control are XData and YData. We add three series to each one for the three series that we want to show. Before that, we clear the arrays, to make sure no previously added data shows on the chart:

 lineChart1.XData.Clear();
 lineChart1.XData.Add(new List{3,4,5,6,7,8,9});
 lineChart1.XData.Add(new List{1,2,3,4,5,6,7,8});
 lineChart1.XData.Add(new List{1,2,3,4,5,6,7,8,9,10});

 lineChart1.YData.Clear();
 lineChart1.YData.Add(new List{92, 112, 241, 195, 201, 188, 212});
 lineChart1.YData.Add(new List{512, 480, 321, 491, 460, 320, 298, 241});
 lineChart1.YData.Add(new List { 340, 302, 322, 401, 487, 503, 421, 460, 513, 490 });

Chart Series

We want to show line series with scatters – since this is the default LineType, we don’t have to set anything. In order to customize our series, we add new pens to the ChartPens property. The colors of the scatters are customized with ShapePens and ShapeBrushes. We make the chart pens a bit thicker – 3 pixels.

 lineChart1.ShapeBrushes.Add(new MindFusion.Drawing.SolidBrush(Color.FromArgb(175, 251, 175)));
 lineChart1.ShapeBrushes.Add(new MindFusion.Drawing.SolidBrush(Color.FromArgb(176, 224, 230)));
 lineChart1.ShapeBrushes.Add(new MindFusion.Drawing.SolidBrush(Color.FromArgb(216, 191, 216)));

 lineChart1.ChartPens.Add(new MindFusion.Drawing.Pen(Color.FromArgb(144,238,144), 3.0f));
 lineChart1.ChartPens.Add(new MindFusion.Drawing.Pen(Color.FromArgb(70, 130, 180), 3.0f));
 lineChart1.ChartPens.Add(new MindFusion.Drawing.Pen(Color.FromArgb(186, 85, 211), 3.0f));

 lineChart1.ShapePens.Add(new MindFusion.Drawing.Pen(Color.FromArgb(144, 238, 144)));
 lineChart1.ShapePens.Add(new MindFusion.Drawing.Pen(Color.FromArgb(70, 130, 180)));
 lineChart1.ShapePens.Add(new MindFusion.Drawing.Pen(Color.FromArgb(186, 85, 211)));

Separator Line

We would like to show a separator line that indicates the average value from all chart data. We add a SummaryValue to the SummaryValues collection. Then we customize the summary line by specifying its pen, scatter type and scatter size. We also set the pen and the brush for the scatters. Here is how we do it:

  lineChart1.SummaryPens.Add(new MindFusion.Drawing.Pen(Color.FromArgb(255,69,0), 4.0f);
  lineChart1.SummaryShapeBrushes.Add(new MindFusion.Drawing.SolidBrush(Color.FromArgb(255,228,225))); 
  lineChart1.SummaryShapePens.Add(new MindFusion.Drawing.Pen(Color.FromArgb(255,69,0));
  lineChart1.SummaryShapes.Add(MindFusion.Charting.Shape.Rhombus);
  lineChart1.SummaryShapeSizes.Add(15.0);
  lineChart1.SummaryValues.Add(MindFusion.Charting.Summary.Average);   

Axes Labels

We want to show custom text at the X-axis, so we set XAxisSettings.LabelType to AxisLabelType.CustomText. We use the XLabels property to add the labels. We also add a title with the XAxisSettings.TitleLabel property.

For the Y-axis we want to show the auto scale – we set it with YAxisSettings.MaxValue, YAxisSettings.MinValue and YAxisSettings.AxisDelta. We show ticks on both axes with the MajorTickLength property.

 lineChart1.YAxisSettings.AxisDelta = 50;
 lineChart1.YAxisSettings.MajorTickLength = 2F;
 lineChart1.YAxisSettings.MaxValue = 600;
 lineChart1.YAxisSettings.MinValue = 0;

 lineChart1.XAxisSettings.AxisDelta = 1;
 lineChart1.XAxisSettings.LabelType = MindFusion.Charting.AxisLabelType.CustomText;
 lineChart1.XAxisSettings.MajorTickLength = 5F;
 lineChart1.XAxisSettings.MaxValue = 11;
 lineChart1.XAxisSettings.MinValue = 0;
 lineChart1.XAxisSettings.TitleLabel = "Year";

The Legend

The labels for the legend are set with the LegendLabels property. The colors are picked automatically from the ChartPens property for each series. We place the legend at the bottom with LegendPosition and increase its offset with LegendOffset. We want the legend in one row, so we set LegendColumns to the count of the labels – 3.

 lineChart1.LegendColumns = 3;
 lineChart1.LegendLabels = new List{"Europe, Asia, North America"};
 lineChart1.LegendOffset = 30f;
 lineChart1.LegendPosition = MindFusion.Charting.Position.Bottom;

Here is a screenshot from the final chart:

Scatter Chart with a Custom Legend

Scatter Chart with a Custom Legend

You can download the sample from this link:

Download Scatter Chart with a Custom Legend Sample

The trial version of MindFusion.Chart for WinForms boasts many different samples, great charting tips and step by step tutorials. You can download it directly from here:

Download MindFusion.Charting for WinForms 3.5 Trial Version

About MindFusion.Charting for WinForms: a professional programming component for WinForms, which lets you create remarkable charts fast and easy. The tool supports all major chart types – line, pie, radar and bar – and numerous variations of them – column, area, bubble, polar, doughnut etc. 3D charts are supported as well.

Charting for WinForms supports a rich user interaction model with features like zoom, hit testing, drill down, mouse dragging and more. You can use delegates to present mathematical functions, undefined values are also acceptable. Values can be data arrays or retrieved through a database.

The appearance of each chart is fully customizable. The control offers strong design-time support with custom collection editors and chart wizards. At your disposal is a set of predefined appearance themes and a theme editor tool. A full list of the features can be read here.

ASP.NET Bar Chart with Custom Labels

In this blog post we will look on how to build a bar chart with multiple series, custom X-labels and inner labels using MindFusion.Charting for ASP.NET control.

1. General Appearance of the Chart

We want to show three data series and we want to show the first values of each series in a cluster, then second cluster with the second values of each series etc. In order to render the bars in this order we set the BarType property to BarType.Clustered3D. We correct the Depth3D to make the bars less thick and increase the distance between each series with DistBtwBars. We make the bars wider, setting BarWidth to 30.

    //general appearance
    BarChart1.BarType = MindFusion.Charting.BarType.Clustered3D;
    BarChart1.BarWidth = 30f;        
    BarChart1.Depth3D = 15f;
    BarChart1.DistBtwBars = 10f;

2. Grid

Our bars are vertical e.g. it is a column chart, so we would like to have a horizontal grid. We set the GridType property to GridType.HorScale and we set the AltGridBrush and GridBruh to different gray colors to give us nice alternating grid stripes. For the outlining of the whole plot area we use the PlotAreaOutlinePen.

    //grid settings
    BarChart1.GridBrush= new MindFusion.Drawing.SolidBrush(System.Drawing.Color.FromArgb(242, 239, 224));
    BarChart1.GridPen= new MindFusion.Drawing.Pen(System.Drawing.Color.FromArgb(204, 196, 185));
    BarChart1.GridType = MindFusion.Charting.GridType.HorScale;
    BarChart1.PlotAreaOutlinePen = new MindFusion.Drawing.Pen(System.Drawing.Color.FromArgb(204, 196, 185));

3. Labels Inside Bars

The labels inside bars show the data of each bar – this is done by setting the InnerLabelType property to LabelType.Data. We use a white LabelBrush to draw the labels and set their InnerLabelBorder to Border.RoundedRect. The background of the inner labels is set to gray.

    //inner labels settings
    BarChart1.InnerLabelBackground = new MindFusion.Drawing.SolidBrush(System.Drawing.Color.FromArgb(112, 128, 144));
    BarChart1.InnerLabelBorder = MindFusion.Charting.Border.RoundedRect;
    BarChart1.InnerLabelType = MindFusion.Charting.LabelType.Data; 
    BarChart1.LabelBrush = new MindFusion.Drawing.SolidBrush(System.Drawing.Color.FromArgb(255, 255, 255));

4. Title

We want not only title but also second title – or a subtitle. That’s why we use both the TitleText and SubTitleText properties. We leave no distance between them – we set SubTitleOffset to 0. But we would like the two titles to be well above the plot area, that’s why we set bigger TitleOffset.

    //title and subtitle
    BarChart1.SubTitleOffset = 30;
    BarChart1.SubTitleText = "all major continents";
    BarChart1.TitleOffset = 0;
    BarChart1.TitleText = "Sales";

5. Labels at the Axes

The X-labels are custom text – we set them with XLabels. The title of the Y-axis is rotated, so we use LabelOrientation.BottomToTop.

    //axes labels settings
    BarChart1.XAxisSettings.LabelSeriesIndex = 1;
    BarChart1.XLabels.Clear();
    BarChart1.XLabels.Add(new List(){ "Europe", "Asia", "North America", "South America"});
    
    BarChart1.YAxisSettings.TitleLabel = "in mlns. USD";
    BarChart1.YAxisSettings.TitleLabelOrientation = MindFusion.Charting.LabelOrientation.BottomToTop;

Here is a screenshot of the final chart:

ASP.NET Bar Chart with Custom Labels

ASP.NET Bar Chart with Custom Labels

The sample can be downloaded from here:

Download ASP.NET Bar Chart with Labels Sample

The trial version of MindFusion.Charting for ASP.NET can be downloaded directly from the link below. It contains many more samples and tutorials:

Download MindFusion.Charting for WebForms Trial Version

About MindFusion.Charting for WebForms: A powerful WebForms control that lets programmers add compelling charts in any ASP.NET application. With the component you can design and create any bar, column, line, area, scatter, bubble, radar, polar, doughnut and pie chart. Its elegant API includes data binding, themes, hit-testing, zoom, drill-down, wizards and many more.

The control takes advantage of the rich capabilities of Microsoft WebForms but its functionality does not bring excess complexity. The API is very easy to understand, all the features are duly documented. Numerous samples and step-by-step tutorials let you learn quickly how to tailor the tool in order to meet best your needs.

Details about the various features of the control are provided here. The online demo will give you an overview of the control’s rich capabilities. Licenses, prices and discounts are listed at the buy page.

Working Hours Bar Chart in WinForms

In this post we will explore how to create a bar chart that shows the weekly working hours for each
member of a team. We use MindFusion.Charting for WinForms component.

The Type of the Bar Chart

We decide to use a horizontal bar chart, which will give a clear visual representation of the data in this case. We use the BarType property to choose the bar type and set the Horizontal property:

barChart1.Horizontal = true;
barChart1.BarType = MindFusion.Charting.BarType.Single3D;

A 3D chart would look more sophisticated so we choose “Single3D” for a BarType.

The Data

We don’t need to set data for both axes – one is enough. The control automatically sets values for the
other axis to make the bars equally distributed. We can write the data by hand or use the built-in
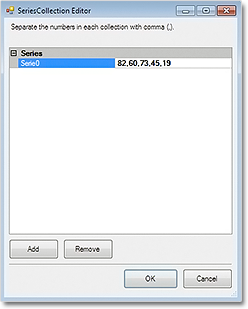
design time collection editor:


barChart1.Data.Add(new List() { 82, 60, 73, 45, 19, 34, 58, 23, 69, 17 });

The data collection editor

The data collection editor

The Axes

The X-axis shows a scale of the total working hours for the week. We set its LabelType to “AutoScale
and set the interval to 10:

barChart1.XAxisSettings.LabelType = MindFusion.Charting.AxisLabelType.AutoScale;
barChart1.XAxisSettings.AxisDelta = 10;

This is the only axis that shows numbers on the chart, so we show the starting zero number:

barChart1.XAxisSettings.DrawZero = true;

We want to show whole numbers at the axis – no decimal fractions – and we use the NumberFormat property to set this:

barChart1.XAxisSettings.NumberFormat = MindFusion.Charting.NumberFormat.Fixed_point_0Digits;

Finally, we set the title:

barChart1.XAxisSettings.TitleLabel = "Total Weekly Hours";

For the Y-axis we want to show custom labels – the name of each employee. We use the YLabels property to specify the labels and set YAxisSettings.LabelType to the appropriate value:

barChart1.YAxisSettings.LabelType = MindFusion.Charting.AxisLabelType.CustomText;
barChart1.YLabels.Add(new List() { "Mary Johnson", "Tim Davidson", "Alan Hank", "Elisa Labate", "Boris Foster", "Tim Carnes", "Olivia Beverling", "Mark Buchanan", "Ron Callary", "Cindy Peterson" });

The Grid

A vertical grid will help us identify the value of each bar. The GridType property, together with the
GridBrush and AltGridBrush help use set the type and colors of the grid. We outline the plot area with PlotAreaOutline:

GridType = MindFusion.Charting.GridType.VertScale;
barChart1.GridBrush = new MindFusion.Drawing.SolidBrush(Color.White);
barChart1.AltGridBrush = new MindFusion.Drawing.SolidBrush(Color.FromArgb(240, 240, 240));
PlotAreaOutlinePen = new MindFusion.Drawing.Pen(Color.FromArgb(220, 220, 220));

The Bar Colors

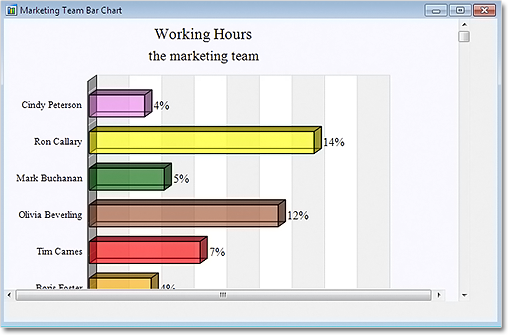
We use ChartBrushes and ChartPens to specify how our bars will be colored. Here is the final chart:

3D BarChart in .NET WinForms

3D BarChart in .NET WinForms

Scrolling the chart:

We set the ResizeType to “Scrollable“. This way we can scroll to see all data on the chart without the need to increase the size of the chart and let it take too much space.

barChart1.ResizeType = MindFusion.Charting.WinForms.ResizeType.Scrollable;

The sample is available for download from here:

Download WinForms Working Hours Bar Chart Sample

A trial version of MindFusion.Charting for WinForms is available from here:

Download MindFusion.Charting for WinForms

Line Chart in Silverlight with Two Legends, Scatters and Custom Labels

In this post we are discussing how to build a line chart with multiple series, scatters in custom colors,
two legends and custom labels at the X-axis. We are building the chart in Silverlight, using the
MindFusion.Charting for Silverlight tool.

Data

The data for the chart is taken from an ObservableCollection, where each member represents sales for a
given month.

lineChart1.DataSource = sales;

The Axes

The Y-axis shows an auto scale. This is the default LabelType so we don’t need to change it. But we want custom title label and intervals of 100. Here is how we set this:

lineChart1.YAxisSettings.Interval = 100L;
lineChart1.YAxisSettings.TitleOffset = 10.0;
lineChart1.YAxisSettings.Title = "USD";

The X-axis requires more customization. We want to show custom labels, that’s why we must set them and change the LabelType to show them:

lineChart1.XAxisSettings.LabelType = LabelType.CustomText;
lineChart1.XAxisSettings.CustomLabelPosition = CustomLabelPosition.ChartDataPoints;

We use the XLabelPath property to bind the Month field in our DataSource to the X-labels of the chart. We also set the maximum value at the X-axis and draw pointers to the labels by setting the Tick property.


lineChart1.XAxisSettings.MaxValue = sales.Count + 1;
lineChart1.XAxisSettings.Tick = 5.0;

The Series

The data for each series comes from a specific field in the DataSource collection:

lSeries1.YDataPath = "Turnover";
lSeries2.YDataPath = "Profit";

We want to show scatters and we use the ScatterType property to set the type. By default the type is “None” and no scatters are drawn. We need to change that:

lSeries1.ScatterType = ScatterType.Diamond;
lSeries1.ScatterSize = 20;

The brushes for the scatters are set with a BrushCollection:

BrushCollection sBrushes1 = new BrushCollection();
sBrushes1.Add(new SolidColorBrush(Colors.Red));
sBrushes1.Add(new SolidColorBrush(Colors.Yellow));
sBrushes1.Add(new SolidColorBrush(Colors.Green));


lSeries1.ScatterFills = sBrushes1;

Finally, don’t forget to add your LineSeries to the chart:

lineChart1.Series.Add(lSeries1);
lineChart1.Series.Add(lSeries2);

Legends

In this chart we need two legends – one is for the scatters and one for the series. They are both of
type SeriesLegend, which gives us control over the brushes and labels used.

The legend for the scatters is docked to the bottom and is aligned in the center.

MindFusion.Charting.Silverlight.SeriesLegend legend =
new MindFusion.Charting.Silverlight.SeriesLegend();
legend.LabelsSource = new List() { "Higher than expected", "Lower than expected", "Meets expectations"};
legend.BorderBrush = new SolidColorBrush(Colors.LightGray);
LayoutPanel.SetDock(legend, Dock.Bottom);
legend.HorizontalAlignment = System.Windows.HorizontalAlignment.Center;

Here is how we set the brushes:

BrushCollection brushes = new BrushCollection();
brushes.Add(new SolidColorBrush(Colors.Green));
brushes.Add(new SolidColorBrush(Colors.Red));
brushes.Add(new SolidColorBrush(Colors.Yellow));
legend.BrushesSource = brushes;
lineChart1.Legends.Add(legend);

The code for the other legend is similar, but we dock it to the right and align it to the top:

LayoutPanel.SetDock(sLegend, Dock.Right);
sLegend.VerticalAlignment = System.Windows.VerticalAlignment.Top;

Finally, don’t forget to add the two legends to the chart:

lineChart1.Legends.Add(legend);
lineChart1.Legends.Add(sLegend);

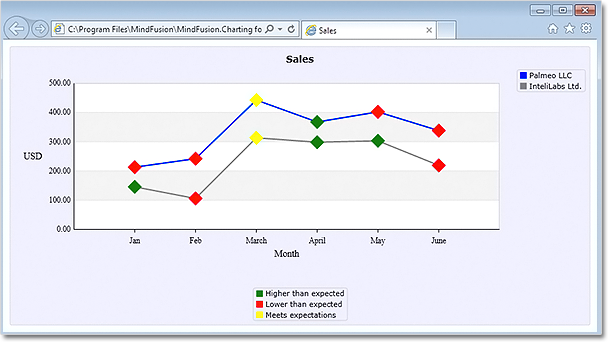
Here is the final result:

Line chart with scatters, two legends and custom labels. The platform is Silverlight.

Line chart with scatters, two legends and custom labels. The platform is Silverlight.

The source code is available for download from here:

Download the Complete Source Code for the Sample

You can get the trial version of MindFusion.Charting for Silverlight from this link:

Download MindFusion.Charting for Silverlight Trial Version