Diagramming for JavaScript with jQuery

Diagramming for JavaScript can use jQuery for browser abstraction instead of Microsoft Ajax. If you want to try the new feature, please download this archive containing a pre-release mindfusion.diagramming.js build and a sample page:

https://mindfusion.eu/_beta/jsdiag_jquery.zip

To enable jQuery support, set MindFusionImpl=”JQuery” before loading the diagram script:

Code:

MindFusionImpl = "JQuery"; 

Instead of MSAjax $create function, use the static Diagram.create(element) method to create a Diagram instance for given Canvas element:

Code:

diagram = MindFusion.Diagramming.Diagram.create($("#diagram")[0]); 
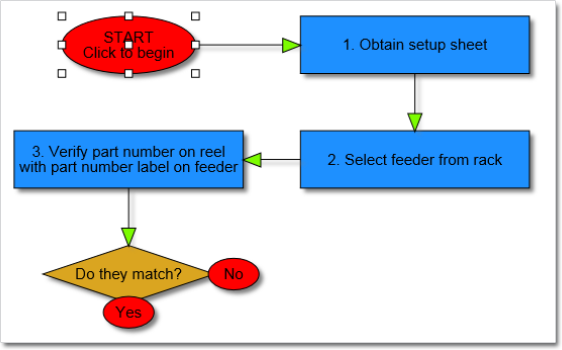
A sample diagram.

A sample diagram.

We welcome any comments, suggestions and feedback. You can write us at e-mail support@mindfusion.eu or use the help desk. You can use the JsDiagram section on MindFusion forum to post questions about the tool.

About Diagramming for JavaScript Library: Written 100% in JavaScript, this tool uses HTML5 Canvas to draw impressive diagrams, schemes, flowcharts, trees and many more. It is browser independent, easy to use and integrate into any web application. JsDiagram supports a variety of predefined node shapes, customizable links, rich event set and many appearance options. The user interaction model includes resizing / moving / selecting and modifying any diagram element.

The tool boasts an elegant API, which is documented in details as well numerous step-by-step guides and tutorials. Various samples are provided to let you learn quickly how to use the most important features of the library – check them here. JsDiagram is not only the perfect choice for creating any type of diagram in the browser – it can also arrange it the way you wish with a mouse click using one of its automatic graph layout algorithms. For more details about the features of the component, please visit the JsDiagram page.

Diagramming for ASP.NET, V5.2 and Diagramming for ASP.NET MVC, V2.1

MindFusion has released a new version of NetDiagram and of MvcDiagram. Both components boast two new layouts:

Tree map layout
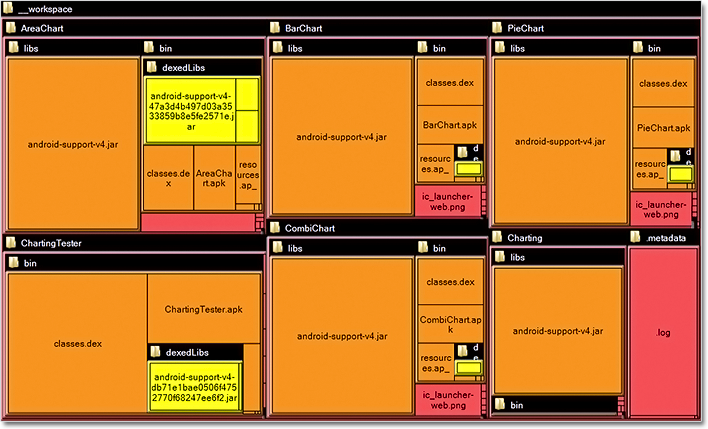
Tree maps represent hierarchies by nesting child nodes within their parents, where the areas of leaf nodes are proportional to their Weight values. Unlike other layout algorithms, TreeMapLayout expects hierarchies to be defined via grouping or containment (see AttachTo method and ContainerNode class), and will ignore any links in the diagram. The diagram area covered by the topmost nodes in a hierarchy is specified via the LayoutArea property. By default, the layout tries to keep the ratio of node sides as close as possible to one.

The tree map layout.

The tree map layout.

Decision flowchart layout
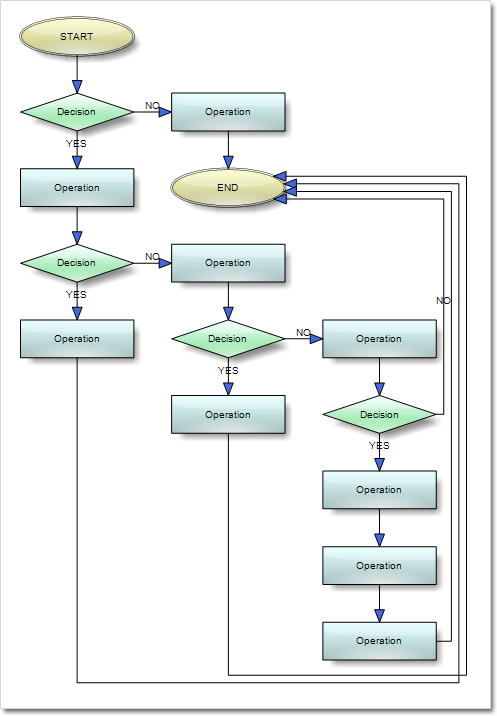
DecisionLayout arranges simple flowcharts consisting of decision boxes with up to three outgoing links per node and activity boxes with a single outgoing link per node. The nodes are arranged in columns and rows, whose distance depends on the HorizontalPadding and VerticalPadding property values. When links share the same row or column, they are placed at a distance specified via LinkPadding. The layout arranges nodes recursively starting from StartNode.

The decision layout.

The decision layout.

Miscellaneous

  • Layout algorithms now automatically resize diagram’s Bounds if it’s not large enough to fit the arranged content. To revert to old behavior and keep fixed Bounds size, set GrowToFit to false.
  • A few bugs have been cleared – read details for NetDiagram here and for MvcDiagram here.

Trial versions of the components are available for download from the following links:

Download MindFusion.Diagramming for ASP.NET, V5.2 Trial Version

Download MindFusion.Diagramming for ASP.NET MVC, V2.1 Trial Version

MindFusion support team is happy to assist you with any questions you might have about Diagramming for ASP.NET MVC or any other of our products. You can leave a message at the discussion board, use the help desk or e-mail support@mindfusion.eu.. We aim to provide competent and detailed answers to your questions within hours of receiving them.

About Diagramming for ASP.NET: An advanced WebForms programming component that offers all the functionality that is needed for creating, styling and presenting attractive flowcharts, hierarchies, trees, graphs, schemes, diagrams and many more. The control offers numerous utility methods, path finding and cycle detection, rich event set and many useful user interaction features like tool tips, multiple selection, copy/paste to/from Windows clipboard and many more.

NetDiagram offers over 100 predefined node shapes, scrollable tables, 13 automatic layouts and many more. You can check the online demo to see some of the features in action. The control includes many samples, detailed documentation and step-by-step tutorials. Every features is duly documented and there’s plenty of code to copy. The component is not only powerful and scalable, but easy to learn and fun to use.

About Diagramming for ASP.NET MVC Control: It is a multi-purpose diagramming tool that consists of two parts: a .NET class library running on the server and a client side control implemented in JavaScript. The server side .NET library implements a flow-diagramming object model that lets you define structures such as trees, flowcharts and graphs. Every element in the diagram is easily accessible and the whole diagram is rendered as part of an HTML page by just calling the DiagramView extension method.

On the client the diagram is rendered by a DiagramView JavaScript control that draws its content on an HTML Canvas. The user is able to add nodes and links simply by drawing them with the mouse. There is also a NodeListView control, which lets users create new nodes via drag and drop. MvcDiagram also supports various automatic layout algorithms that will make every diagram easy to understand and nice to look at. The diagram can also be easily serialized in binary or XML format.

Exporting is done in a variety of formats including Pdf, Svg, Visio and more. You can read details about the components at the MvcDiagram features page.

Diagramming for WinForms, V6.2 Released

MindFusion has released a new version of its Diagramming component for WinForms. It adds two new layout algorithms, available in the professional edition. Here are details:

Tree map layout
Tree maps represent hierarchies by nesting child nodes within their parents, where the areas of leaf nodes are proportional to their Weight values. Unlike other layout algorithms, TreeMapLayout expects hierarchies to be defined via grouping or containment (see AttachTo method and ContainerNode class), and will ignore any links in the diagram. Read further details about the algorithm here.

The tree map layout.

The tree map layout.

Decision flowchart layout
DecisionLayout arranges simple flowcharts consisting of decision boxes with up to three outgoing links per node and activity boxes with a single outgoing link per node. The nodes are arranged in columns and rows, whose distance depends on the HorizontalPadding and VerticalPadding property values. When links share the same row or column, they are placed at a distance specified via LinkPadding. More about the layout here.

The decision layout.

The decision layout.

Miscellaneous
Layout algorithms now automatically resize diagram’s Bounds if it’s not large enough to fit the arranged content. To revert to old behavior and keep fixed Bounds size, set GrowToFit to false.

You can read further details about this release at the news page in the Diagramming for WinForms forum. If you are willing to try the new version here is a link to download it:

Diagramming for WinForms, V6.2

If you have questions or run into problems using the component you can use the Diagramming for WinForms forum, the help desk or write us at support@mindfusion.eu. Our support team will be pleased to help you.

About MindFusion.Diagramming for WinForms: A programming component that provides any WinForms application with a full set of features for creating and customizing all types of diagrams, flowcharts, schemes, hierarchies, trees, graphs etc. The control provides numerous ways to save and load a diagram, six auxiliary controls and more than 12 automatic graph layout algorithms. Diagram elements include scrollable tables, container nodes, multi-segment arrows, custom diagram item types and many more. Further
details here.

Diagramming for WinForms is a royalty-free component, clients get 12 month upgrade subscription when buying a license. The source code is also available for purchase. Visit the buy page for a list with the current license prices.

MindFusion.Diagramming for ASP.NET MVC, V2.0

MindFusion has released Diagramming for ASP.NET MVC, V2.0 with an impressive list of new features. Here is an overview of the most important of them:

Undo/redo support
If you set the UndoEnabled property to true, the Diagram control tracks changes done to its items and you can undo and redo them later by calling the undo() and redo() methods respectively. You can record multiple changes as a single undoable operation by enclosing them between startCompositeOperation() and commitCompositeOperation() calls. You can also create custom undoable operations.

Animations
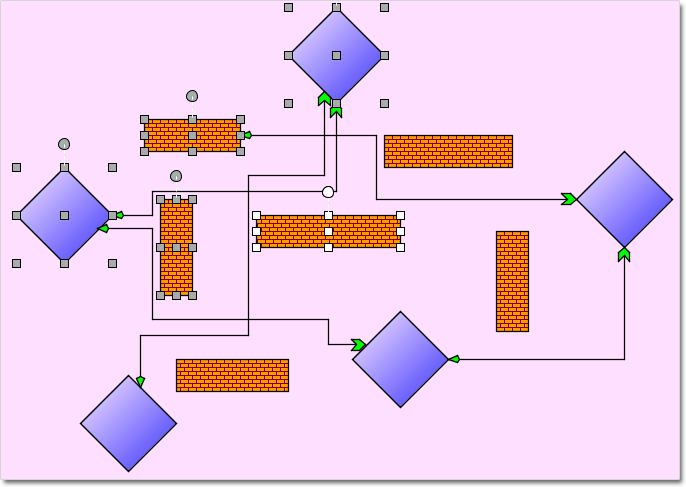
You can animate diagram items with the new Animation class in the MindFusion.Animations namespace. The class implements several built-in animation and easing types, and you can define custom animation functions as well.
Animations

Animations

Clipboard support
A set of new methods – copyToClipboard, cutToClipboard and pasteFromClipboard make it possible to use clipboard operations on a single item or a selection of items.

Swimlanes
The lane grid lets you emphasize the relationship between a group of diagram items by displaying them in a distinct lane or cell within the grid. To display the lane grid set the EnableLanes property of the Diagram class to true. The various attributes exposed by the LaneGrid property let you customize the grid – you can specify the number of rows and columns, add headers, customize the cell appearance, etc.
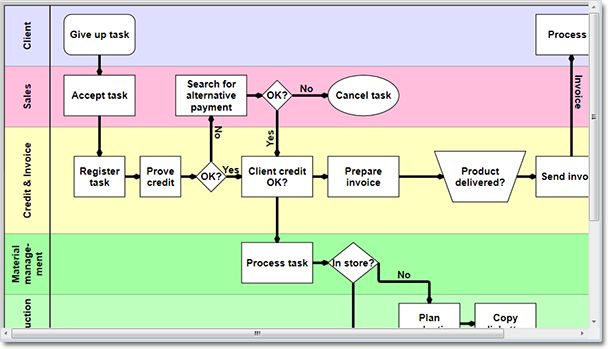
A diagram with swimlanes.

A diagram with swimlanes.

Resize of multiple nodes
The new AllowMultipleResize property lets you resize multiple selected nodes simultaneously. When the property is enabled, dragging a corner or side adjustment handle of any node resizes all nodes in the selection. You can cancel the operation.

Magnifier
The new magnifier tool lets users zoom in or out portions of the diagram by holding down a modifier key or pressing a mouse button. The magnifier’s appearance – its zoom factor, shape, size, frame color – can be customized with properties.
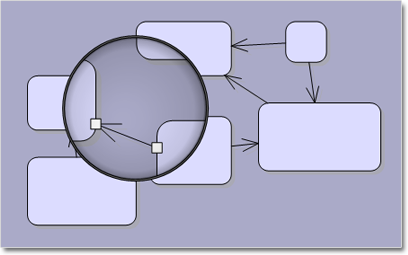
The Magnifier Tool

The Magnifier Tool

Intellisense support
The package includes a MindFusion.Diagramming-vsdoc.js file that provides code completion information. To load it in Visual Studio, add e /// tag to the top of your script files. Use the static Diagram.create and Diagram.find methods instead of $create and $find to let Visual Studio infer the type of returned Diagram objects correctly.

Export of Visio 2013 files
You can export the content of Diagram and DiagramDocument objects to Visio 2013 VSDX files. In order to use the exporter, add a reference to the MindFusion.Diagramming.Export.Visio.dll assembly. Currently, the exporter supports shapes from Visio basic stencil. Support for more shapes will be added upon request.

Improvements in the Visio2013Importer

  • The importer now supports Visio group shapes. Child shapes in groups are no longer lost when importing, and their corresponding diagram nodes are attached to the corresponding group node.
  • Visio NURBS curves are now imported as Bezier-style links.
  • Fix for importing connectors with applied rotation transform.
  • Shapes with a ‘hidden’ attribute in master definition are now imported as invisible items.

Headers and footers in PDF
The PdfExporter can add headers and footers to the exported pages. Use the HeaderFormat, HeaderFont, FooterFormat and FooterFont properties to customize the header and the footer.

Miscellaneous
Set the ModificationStart property to AutoHandles to let users start moving or resizing an item without selecting it first.

  • The diagram area can be resized automatically to fit the current diagram items as set through the AutoResize property.
  • The AutoScroll property enables automatic scrolling when the mouse is dragged near the diagram edges.
  • enterInplaceEditMode and leaveInplaceEditMode events raised when the control shows or hides the in-place edit box.
  • as well other new properties and features.

You can find further details about the release here. The trial version is available for download from the link below:

Download MindFusion.Diagramming for ASP.NET MVC, V2.0

MindFusion support team is happy to assist you with any questions you might have about Diagramming for ASP.NET MVC or any other of our products. You can leave a message at the discussion board, use the help desk or e-mail support@mindfusion.eu.. We strive to provide competent and detailed answers to your questions within hours of receiving them.

About Diagramming for ASP.NET MVC Control: It is a multi-purpose diagramming tool that consists of two parts: a .NET class library running on the server and a client side control implemented in JavaScript. The server side .NET library implements a flow-diagramming object model that lets you define structures such as trees, flowcharts and graphs. Every element in the diagram is easily accessible and the whole diagram is rendered as part of an HTML page by just calling the DiagramView extension method.

On the client the diagram is rendered by a DiagramView JavaScript control that draws its content on an HTML Canvas. The user is able to add nodes and links simply by drawing them with the mouse. There is also a NodeListView control, which lets users create new nodes via drag and drop.

MvcDiagram also supports various automatic layout algorithms that will make every diagram easy to understand and nice to look at. The diagram can also be easily serialized in binary or XML format. Exporting is done in a variety of formats including Pdf, Svg, Visio and more. You can read details about the components at the MvcDiagram features page.

Diagramming for Java, V4.0.5 Released

MindFusion has released a new version of its Diagramming library for Java. Here is an overview of the new features:

Resize of multiple nodes

The new version lets you resize multiple nodes simultaneously – just call Diagram.setAllowMultipleResize(true) to enable it. When enabled, dragging a corner or side adjustment handle of any node resizes all nodes in the selection.

Multiple selection of nodes.

Multiple selection of nodes.

VisioImporter Improvements

  • The Item argument of the VisioImportListener.importItem event handlers is now pre-set to a
    DiagramItem instance created for the imported Visio shape, letting you avoid parsing some standard data such as Bounds or Text.
  • A few bugs have been fixed

ZoomControl Improvements

  • Changing DiagramView.ZoomFactor now automatically updates the zoom control slider
  • the pan widget now fills the ZoomControl width or height instead of having fixed size.
  • setting ZoomControl’s width larger than its height makes the zoom slider horizontal.

We have also made a few API changes – read details here. The trial version is available for download from the following link:

Download MindFusion.Diagramming for Java Swing, V4.0.5 Trial

Technical support

MindFusion puts special effort in providing high quality technical support to all its clients and evaluators. You can post your questions about Diagramming for Java or any other of our components at the forum, help desk or at support@mindfusion.eu. All support inquiries are usually answered within hours of being received.

About Diagramming for Java Swing: MindFusion.Diagramming for Java Swing provides your Java application with all necessary functionality to create and customize a diagram. The library is very easy to integrate and program. There are numerous utility methods, rich event set, more than 80 predefined shapes. The tool supports a variety of ways to render or export the diagram, advanced node types like TreeView nodes, hierarchical nodes, tables, container nodes and many more. There are 15 automatic layouts, various input / output options and fully customizable appearance. A detailed list with JDiagram’s features is uploaded here. You can check the online demo to see some of the functionality implemented.

Diagramming for Java Swing is royalty free, there are no distribution fees. Licenses depend on the count of developers using the tool – check here the prices.