In this post we show you how to build a multi-series scatter chart with a legend and a separator. We use MindFusion.Charting tool for WinForms.
The Data
The properties that specify data in the control are XData and YData. We add three series to each one for the three series that we want to show. Before that, we clear the arrays, to make sure no previously added data shows on the chart:
 lineChart1.XData.Clear();
 lineChart1.XData.Add(new List{3,4,5,6,7,8,9});
 lineChart1.XData.Add(new List{1,2,3,4,5,6,7,8});
 lineChart1.XData.Add(new List{1,2,3,4,5,6,7,8,9,10});

 lineChart1.YData.Clear();
 lineChart1.YData.Add(new List{92, 112, 241, 195, 201, 188, 212});
 lineChart1.YData.Add(new List{512, 480, 321, 491, 460, 320, 298, 241});
 lineChart1.YData.Add(new List { 340, 302, 322, 401, 487, 503, 421, 460, 513, 490 });
Chart Series
We want to show line series with scatters – since this is the default LineType, we don’t have to set anything. In order to customize our series, we add new pens to the ChartPens property. The colors of the scatters are customized with ShapePens and ShapeBrushes. We make the chart pens a bit thicker – 3 pixels.
 lineChart1.ShapeBrushes.Add(new MindFusion.Drawing.SolidBrush(Color.FromArgb(175, 251, 175)));
 lineChart1.ShapeBrushes.Add(new MindFusion.Drawing.SolidBrush(Color.FromArgb(176, 224, 230)));
 lineChart1.ShapeBrushes.Add(new MindFusion.Drawing.SolidBrush(Color.FromArgb(216, 191, 216)));

 lineChart1.ChartPens.Add(new MindFusion.Drawing.Pen(Color.FromArgb(144,238,144), 3.0f));
 lineChart1.ChartPens.Add(new MindFusion.Drawing.Pen(Color.FromArgb(70, 130, 180), 3.0f));
 lineChart1.ChartPens.Add(new MindFusion.Drawing.Pen(Color.FromArgb(186, 85, 211), 3.0f));

 lineChart1.ShapePens.Add(new MindFusion.Drawing.Pen(Color.FromArgb(144, 238, 144)));
 lineChart1.ShapePens.Add(new MindFusion.Drawing.Pen(Color.FromArgb(70, 130, 180)));
 lineChart1.ShapePens.Add(new MindFusion.Drawing.Pen(Color.FromArgb(186, 85, 211)));
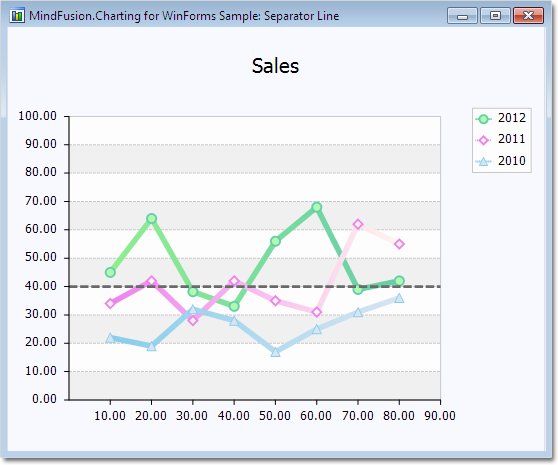
Separator Line
We would like to show a separator line that indicates the average value from all chart data. We add a SummaryValue to the SummaryValues collection. Then we customize the summary line by specifying its pen, scatter type and scatter size. We also set the pen and the brush for the scatters. Here is how we do it:
  lineChart1.SummaryPens.Add(new MindFusion.Drawing.Pen(Color.FromArgb(255,69,0), 4.0f);
  lineChart1.SummaryShapeBrushes.Add(new MindFusion.Drawing.SolidBrush(Color.FromArgb(255,228,225)));
  lineChart1.SummaryShapePens.Add(new MindFusion.Drawing.Pen(Color.FromArgb(255,69,0));
  lineChart1.SummaryShapes.Add(MindFusion.Charting.Shape.Rhombus);
  lineChart1.SummaryShapeSizes.Add(15.0);
  lineChart1.SummaryValues.Add(MindFusion.Charting.Summary.Average);
Axes Labels
We want to show custom text at the X-axis, so we set XAxisSettings.LabelType to AxisLabelType.CustomText. We use the XLabels property to add the labels. We also add a title with the XAxisSettings.TitleLabel property.
For the Y-axis we want to show the auto scale – we set it with YAxisSettings.MaxValue, YAxisSettings.MinValue and YAxisSettings.AxisDelta. We show ticks on both axes with the MajorTickLength property.
 lineChart1.YAxisSettings.AxisDelta = 50;
 lineChart1.YAxisSettings.MajorTickLength = 2F;
 lineChart1.YAxisSettings.MaxValue = 600;
 lineChart1.YAxisSettings.MinValue = 0;

 lineChart1.XAxisSettings.AxisDelta = 1;
 lineChart1.XAxisSettings.LabelType = MindFusion.Charting.AxisLabelType.CustomText;
 lineChart1.XAxisSettings.MajorTickLength = 5F;
 lineChart1.XAxisSettings.MaxValue = 11;
 lineChart1.XAxisSettings.MinValue = 0;
 lineChart1.XAxisSettings.TitleLabel = "Year";
The Legend
The labels for the legend are set with the LegendLabels property. The colors are picked automatically from the ChartPens property for each series. We place the legend at the bottom with LegendPosition and increase its offset with LegendOffset. We want the legend in one row, so we set LegendColumns to the count of the labels – 3.
 lineChart1.LegendColumns = 3;
 lineChart1.LegendLabels = new List{"Europe, Asia, North America"};
 lineChart1.LegendOffset = 30f;
 lineChart1.LegendPosition = MindFusion.Charting.Position.Bottom;
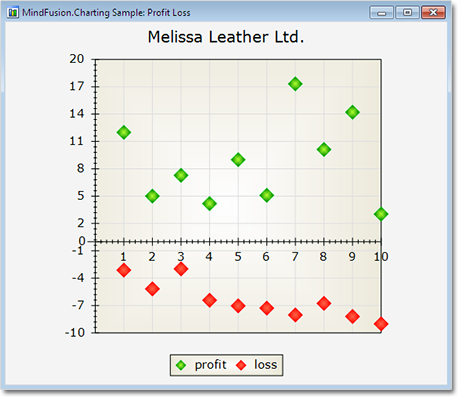
Here is a screenshot from the final chart:
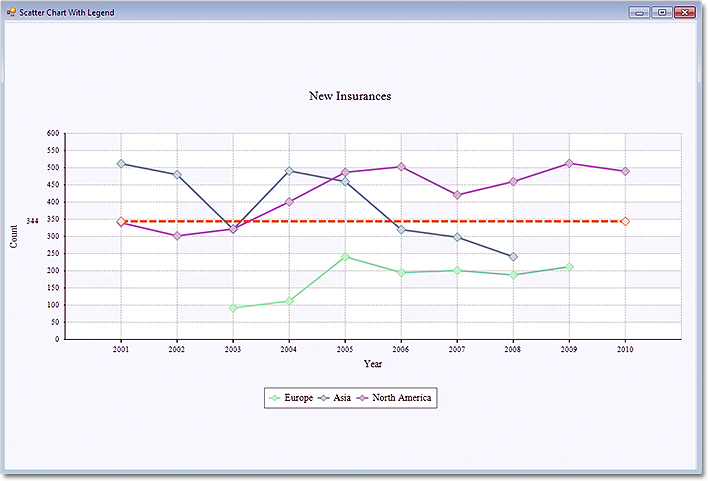
Scatter Chart with a Custom Legend
You can download the sample from this link:
Download Scatter Chart with a Custom Legend Sample
The trial version of MindFusion.Chart for WinForms boasts many different samples, great charting tips and step by step tutorials. You can download it directly from here:
Download MindFusion.Charting for WinForms 3.5 Trial Version
About MindFusion.Charting for WinForms: a professional programming component for WinForms, which lets you create remarkable charts fast and easy. The tool supports all major chart types – line, pie, radar and bar – and numerous variations of them – column, area, bubble, polar, doughnut etc. 3D charts are supported as well.
Charting for WinForms supports a rich user interaction model with features like zoom, hit testing, drill down, mouse dragging and more. You can use delegates to present mathematical functions, undefined values are also acceptable. Values can be data arrays or retrieved through a database.
The appearance of each chart is fully customizable. The control offers strong design-time support with custom collection editors and chart wizards. At your disposal is a set of predefined appearance themes and a theme editor tool. A full list of the features can be read here.