Creating a proprietary invoice editor

In this post we will show how to create an invoice editing application (using MindFusion.Reporting) for the end users of an organization. The source code of the sample is available for download from here:

https://mindfusion.eu/_samples/ReportingInvoiceEditor.zip

Introduction
We start off by creating a new Windows Forms Application in Visual Studio 2010 or later. Change the target framework of the application to “.NET Framework 4” (or later). The ReportEditor component that will be used as an in-place invoice editor requires at least .NET 4.

Add the ReportEditor component to the main form, set its Dock to Fill.

The invoice template
The invoice template displayed by the application is stored in an XML file. The original template is created beforehand and is located in Invoice.xml. All modifications to the template done by the end users will be stored back to the XML file upon exiting the application. Add the following line to the main form’s constructor to load the invoice template when the main form is constructed:

reportEditor1.OpenReport(@"Invoice.xml");

Adding the data source
From the “Data -> Add New Data Source…” menu in Visual Studio create a new data source from the nwind.mdb database. Select the Orders table and the Invoices query in the Data Source Configuration Wizard. In the XML Schema (nwindDataSet.xsd) ensure that there is a relation between the Orders and Invoices table adapters. The relation should link the OrderID fields of the two tables and should be named “Orders_Invoices”. Build the application so that Visual Studio creates the classes for the data set and the selected table adapters. Go back to the main form designer and add nwindDataSet, InvoicesTableAdapter, and OrdersTableAdapter components to the form. In the constructor of the form, add the following lines in order to fill the data set with the data from the source database:

invoicesTableAdapter1.Fill(nwindDataSet1.Invoices);
ordersTableAdapter1.Fill(nwindDataSet1.Orders);

In addition, we need to register the two tables as data sources in the report editor. This is essential because these data sources are used by the invoice report. It is also important that the data sources are registered before the report is initially loaded through the OpenReport method.

reportEditor1.AddDataSource(nwindDataSet1.Orders, "Orders");
reportEditor1.AddDataSource(nwindDataSet1.Invoices, "Invoices");

Saving the template
Override the OnClosing event of the form and add the following line to ensure that all changes to the invoice template are written back to the XML file:

reportEditor1.SaveReport(@"Invoice.xml");

Adding the menu
Create a menu strip for the application with the following structure:

  • File
    • Print
    • Print Preview
    • Exit
  • Edit
    • Undo
    • Redo

Add the following event handlers for the menu items:

private void printToolStripMenuItem_Click(object sender, EventArgs e)
{
	var printer = new ReportPrinter();
	printer.Report = reportEditor1.Report;
	printer.Report.Run();
	printer.Print();
}

private void printPreviewToolStripMenuItem_Click(object sender, EventArgs e)
{
	var printer = new ReportPrinter();
	printer.Report = reportEditor1.Report;
	printer.Report.Run();

	var preview = new PrintPreviewForm();
	preview.Document = printer;
	preview.ShowDialog();
}

private void exitToolStripMenuItem_Click(object sender, EventArgs e)
{
	Close();
}

private void undoToolStripMenuItem_Click(object sender, EventArgs e)
{
	reportEditor1.Undo();
}

private void redoToolStripMenuItem_Click(object sender, EventArgs e)
{
	reportEditor1.Redo();
}

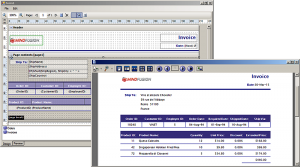
The image below illustrates the running application:

reporting-invoiceeditor

The MindFusion.Reporting component can be downloaded from here:

https://www.mindfusion.eu/ReportingTrial.zip

Enjoy!

Database schema diagram

In this post we’ll show how to use TableNode objects to display tabular data, more specifically database schema information. A Visual Studio sample project containing the code from this post is available for download here:

DatabaseSchema.zip

To start, create a new Windows Forms application, and place a text field for connection string, a button and a DiagramView on the form. In the code-behind file, add following field to map table name to respective TableNode objects:

Dictionary<string, tablenode=""> tables = new Dictionary<string, tablenode="">();
</string,></string,>

Add a RectangleF that stores default size passed to CreateTableNode method:

RectangleF defaultSize = new RectangleF(0, 0, 30, 30);

Create a ReadTables method, which provided an SqlConnection, parses its schema information and creates diagram nodes:

void ReadTables(SqlConnection connection)
{
	// get table schema definitions from connection
	var schema = connection.GetSchema("Tables");
	foreach (DataRow row in schema.Rows)
	{
		// fetch table name
		var name = row["TABLE_NAME"].ToString();

		// create respective node
		var table = diagram.Factory.CreateTableNode(defaultSize);
		table.Caption = name;
		table.Shape = SimpleShape.RoundedRectangle;
		table.Brush = new MindFusion.Drawing.SolidBrush(Color.LightGray);

		// register node in dictionary for future foreign key reference
		tables[name.Replace(" ", "_")] = table;
		ReadFields(table, connection,
			row["TABLE_CATALOG"].ToString(), null, name);
	}

	ReadForeignKeys(connection);
}

The ReadFields method takes table node and name parameters and creates node cells that will show information for the column name and type of database tables:

void ReadFields(TableNode node,
	SqlConnection connection, string db, string owner, string tableName)
{
	// remove default cells
	node.RowCount = 0;

	// reserve one column for name and one for data type
	node.ColumnCount = 2;

	// read column definitions of specified table
	var schema = connection.GetSchema("Columns", new[] { db, owner, tableName });
	foreach (DataRow row in schema.Rows)
	{
		// add a new row to the node
		int r = node.AddRow();

		// set cells' text to the column name and type
		node[0, r].Text = row["COLUMN_NAME"].ToString();
		node[1, r].Text = row["DATA_TYPE"].ToString();

	}

	// make table cells big enough to show all text
	node.ResizeToFitText(false);
}

The ReadForeignKeys method creates DiagramLink connectors between table nodes to show the relationships between database tables:

void ReadForeignKeys(SqlConnection connection)
{
	var schema = connection.GetSchema("ForeignKeys");
	foreach (DataRow row in schema.Rows)
	{
		// read foreign key information
		string fkName = row["CONSTRAINT_NAME"].ToString();
		string tableName = row["TABLE_NAME"].ToString().Replace(" ", "_");
		string prefix = "FK_" + tableName + "_";
		if (fkName.StartsWith(prefix))
		{
			string targetName = fkName.Substring(prefix.Length);

			// get table nodes registered for specified names
			if (tables.ContainsKey(targetName) && tables.ContainsKey(tableName))
			{
				var table = tables[tableName];
				var targetTable = tables[targetName];

				// create a link between the nodes to show relationship
				diagram.Factory.CreateDiagramLink(table, targetTable);
			}
		}
	}
}

Finally handle the button’s click event to open specified connection and call ReadTables. Apply AnnealLayout to arrange the tables so that they do not overlap:

private void btnOpen_Click(object sender, System.EventArgs e)
{
	diagram.ClearAll();

	try
	{
		var connection = new SqlConnection(tbConnection.Text);
		connection.Open();

		// read schema and create corresponding diagram items
		ReadTables(connection);

		connection.Close();
	}
	catch (Exception exception)
	{
		MessageBox.Show(exception.Message);
		diagram.ClearAll();
	}

	// arrange the tables to remove overlaps
	var layout = new AnnealLayout();
	layout.SplitGraph = true;
	layout.Randomize = false;
	layout.MultipleGraphsPlacement = MultipleGraphsPlacement.MinimalArea;
	layout.Margins = new SizeF(10, 10);
	layout.Arrange(diagram);
}

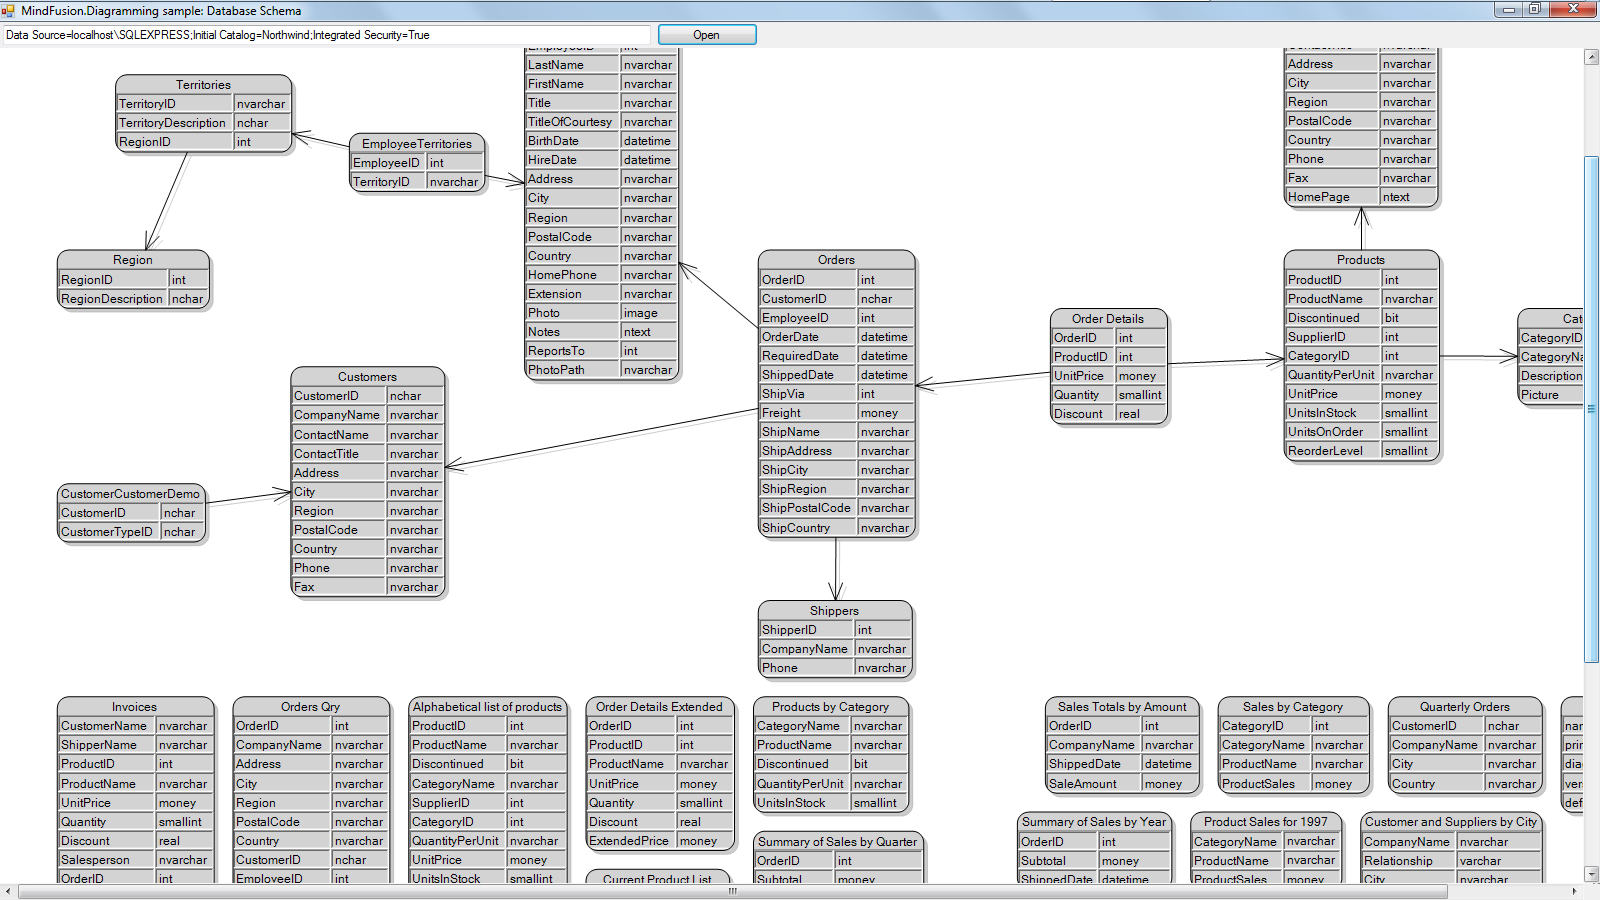
If you run the project and open the Northwind sample database by Microsoft, you should see this diagram:

database schema layout

The code above uses MindFusion’s .NET API and can be used with Windows Forms, WPF, Silverlight and ASP.NET diagramming components. The Java API for Android and desktop Swing application will look similar, with setter method calls instead of property assignments.

You can download the trial version of any MindFusion.Diagramming component from this page.

Enjoy!

MindFusion Controls on NuGet

All MindFusion components for WinForms, WPF and Silverlight are now available as NuGet packages. The following table lists the NuGet IDs of the individual products:

Product NuGet ID
MindFusion.Charting for WinForms
MindFusion.Diagramming for WinForms
MindFusion.Gauges for WinForms
MindFusion.Pack for WinForms
MindFusion.Reporting for WinForms
MindFusion.Scheduling for WinForms
MindFusion.Spreadsheet for WinForms
MindFusion.Charting
MindFusion.Diagramming
MindFusion.Gauges
MindFusion.Pack
MindFusion.Reporting
MindFusion.Scheduling
MindFusion.Spreadsheet
MindFusion.Charting for WPF
MindFusion.Diagramming for WPF
MindFusion.Gauges for WPF
MindFusion.Pack for WPF
MindFusion.Reporting for WPF
MindFusion.Scheduling for WPF
MindFusion.Spreadsheet for WPF
MindFusion.Charting.Wpf
MindFusion.Diagramming.Wpf
MindFusion.Gauges.Wpf
MindFusion.Pack.Wpf
MindFusion.Reporting.Wpf
MindFusion.Scheduling.Wpf
MindFusion.Spreadsheet.Wpf
MindFusion.Charting for Silverlight
MindFusion.Diagramming for Silverlight
MindFusion.Gauges for Silverlight
MindFusion.Pack for Silverlight
MindFusion.Reporting for Silverlight
MindFusion.Scheduling for Silverlight
MindFusion.Charting.Silverlight
MindFusion.Diagramming.Silverlight
MindFusion.Gauges.Silverlight
MindFusion.Pack.Silverlight
MindFusion.Reporting.Silverlight
MindFusion.Scheduling.Silverlight

The complete list of MindFusion products on NuGet can be found here: https://www.nuget.org/profiles/MindFusion.

The NuGet manager is available for Visual Studio 2010, Visual Studio 2012, and Visual Studio 2013 and can be downloaded from here: https://www.nuget.org/.

To install a package, run the following command in the Package Manager Console (accessible from the Visual Studio menu: Tools → NuGet Package Manager → Package Manager Console):

PM> Install-Package 

Where <id> is the NuGet ID of the package. For example, to install MindFusion.Diagramming for WinForms, use:

PM> Install-Package MindFusion.Diagramming

Enjoy!

MindFusion.Gauges: Creating a Stopwatch

This blog will demonstrate how to create a simple stopwatch based on the OvalGauge component (part of MindFusion.Charting for WinForms and MindFusion.Pack for WinForms).

Introduction
We start off by creating a new Windows Forms Application in Visual Studio and adding an OvalGauge control to the main form. Set the gauge’s Dock property to Fill and its Name to “stopwatch”.

Setting up the scales
The stopwatch will contain two scales – a bigger one, which should display the seconds, and a smaller one – for the minutes. The minute scale will be positioned in the upper half of the gauge area. The scales can be created and configured in design-time – through the property grid – or in code. In the Property grid navigate to the Scales property of the OvalGauge control and click the ‘…’ button or hit F4 to open the OvalScale Collection Editor. In this editor, add two scales by pressing the ‘Add’ button. Edit the following properties of the second scale:

Name = "SecondsScale"
StartAngle = -90
EndAngle = 270
StartWidth = 0
EndWidth = 0
Stroke = Color=Black, Width=0

MinorTickSettings.ShowTicks = True
MinorTickSettings.Count = 4
MinorTickSettings.Stroke = Color=(85, 85, 85), Width=0
MinorTickSettings.TickShape = Line
MinorTickSettings.TickWidth = 5%
MinorTickSettings.TickAlignment = OuterInside

MiddleTickSettings.ShowLabels = False
MiddleTickSettings.Count = 5
MiddleTickSettings.Stroke = Color=(0, 0, 0), Width=0
MiddleTickSettings.TickShape = Line
MiddleTickSettings.TickWidth = 8%
MiddleTickSettings.TickAlignment = OuterInside

MajorTickSettings.Count = 12
MajorTickSettings.FontFamily = "Calibri"
MajorTickSettings.FontSize = 20%
MajorTickSettings.FontStyle = Regular
MajorTickSettings.LabelOffset = 9%
MajorTickSettings.LabelRotation = None
MajorTickSettings.ShowMaxValueTick = Never
MajorTickSettings.Stroke = Color=(0, 0, 0), Width=2
MajorTickSettings.TickShape = Line
MajorTickSettings.TickWidth = 12%
MajorTickSettings.TickAlignment = OuterInside

In addition, add four custom intervals to the MajorTickSettings.CustomIntervals collection, representing the intervals [0-0], [15-15], [30-30], and [45-45] respectively. Set the Fill property of each custom interval to (187, 31, 33). These objects indicate that the labels inside the corresponding intervals will be colored in red.

For simplicity, the properties of the minute scale are omitted. They are similar to those of the second scale, the main difference being that the minute scale is positioned and sized through the ScaleRelativeCenter and ScaleRelativeRadius properties.

Adding pointers

In the OvalScale Collection Editor dialog add a pointer to each of the two scales. To do this, select the scale, navigate to the Pointers property in the grid and press the ‘…’ button or F4. This will open the Pointer Collection Editor dialog. Name the pointer of the minute scale “MinutesPointer” and the one in the second scale – “SecondsPointer”. We will use these names later in code to identify and search for the pointers. Set the width of the two pointers to 30% and 20% respectively. Then close all editors. We will custom draw the pointers so there is no need to specify any more properties.

To draw the pointers, handle the PrepaintPointer event of the OvalGauge class. This event is raised for each pointer in the gauge individually before the pointer is painted by the control. The event can be used to cancel the default pointer drawing by setting the CancelDefaultPainting to true. A simplified version of the event handler that paints the two pointers is listed below.

private void stopwatch_PrepaintPointer(object sender, PrepaintEventArgs e)
{
    e.CancelDefaultPainting = true;

    Brush fill = new SolidBrush(Color.FromArgb(175, 8, 9));

    GraphicsState state = e.Graphics.Save();
    e.Graphics.SmoothingMode = SmoothingMode.AntiAlias;
    e.Graphics.ScaleTransform(e.Element.RenderSize.Width, e.Element.RenderSize.Height);

    if (e.Element.Name == "SecondsPointer")
    {
         var polygon = new PointF[]
         {
             new PointF(0.1f, 0.35f),
             new PointF(1, 0.45f),
             new PointF(1, 0.55f),
             new PointF(0.1f, 0.65f)
         };
         var ellipse1 = new RectangleF(0, 0, 0.2f, 1f);

        // Draw the pointer itself
        e.Graphics.FillPolygon(fill, polygon);
        e.Graphics.FillEllipse(fill, ellipse1);
    }
    else if (e.Element.Name == "MinutesPointer")
    {
        var polygon = new PointF[]
        {
            new PointF(0.15f, 0.35f),
            new PointF(1, 0.45f),
            new PointF(1, 0.55f),
            new PointF(0.15f, 0.65f)
        };
        var ellipse1 = new RectangleF(0, 0, 0.3f, 1f);

        e.Graphics.FillPolygon(fill, polygon);
        e.Graphics.FillEllipse(fill, ellipse1);
    }

    e.Graphics.Restore(state);
    fill.Dispose();
}

Activating the stopwatch

Now we need means to start, stop, and reset the stopwatch. First, declare two member variables in the form – startTime and elapsedTime, of type DateTime and TimeSpan respectively. The first variable will store the time when the stopwatch was most recently started. The second variable will store the total elapsed time.

Go to the Visual Studio designer, select the form, navigate to the Padding property and change its value to “0, 0, 0, 50”. The gauge will shrink, leaving some space at the bottom. Add two buttons to the form, below the gauge, and set their texts to “Start” and “Reset” respectively. In addition to the buttons, add a Timer component to the form. When the stopwatch is started, we will use this timer to update the pointers. Handle the Click events of the two buttons. The first button will start/stop the stopwatch. The second button will reset the stopwatch. Here is the event handlers of the two buttons:

private void button1_Click(object sender, EventArgs e)
{
    if (timer1.Enabled)
    {
        UpdateTime();
        UpdatePointers();

        timer1.Stop();
        button1.Text = "Start";
    }
    else
    {
        button1.Text = "Stop";
        startTime = DateTime.Now;
        timer1.Start();
    }
}

private void button3_Click(object sender, EventArgs e)
{
   elapsedTime = TimeSpan.Zero;
   UpdatePointers();
}

Depending on the current state of the application, the first button will either start or stop the timer. The second button will set the elapsed time to 0:00, effectively resetting the stopwatch. Both buttons rely on the method UpdatePointers, which adjusts the gauge pointers according to the currently elapsed time. This method uses the GetElementByName method of the gauge to access the pointers by name and update their values:

private void UpdatePointers()
{
    var minutesPointer = (Pointer)stopwatch.GetElementByName("MinutesPointer");
    var secondsPointer = (Pointer)stopwatch.GetElementByName("SecondsPointer");
    minutesPointer.Value = (float)elapsedTime.TotalMinutes;
    secondsPointer.Value = (float)Math.Round((float)(elapsedTime.TotalSeconds % 60), 1);
}

Finally, handle the Tick event of the timer.

private void timer1_Tick(object sender, EventArgs e)
{
    UpdateTime();
    UpdatePointers();
}

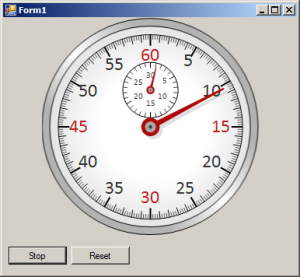
The image below illustrates the running stopwatch:

gauge-stopwatch

The source code of the sample is available for download from here:
https://mindfusion.eu/_samples/GaugesStopwatch.zip

The MindFusion.Charting for WinForms component can be downloaded from here:
https://www.mindfusion.eu/ChartWinFormsTrial.zip

About MindFusion.Charting for WinForms: A professional programming component for WinForms, which lets you create remarkable charts and gauges fast and easy. The tool supports all major chart types – line, pie, radar and bar – and numerous variations of them – column, area, bubble, polar, doughnut etc, as well as oval and linear gauges.

Diagramming for ASP.NET, V5.4.1 & Diagramming for ASP.NET MVC, V2.4

MindFusion is pleased to announce the new releases of its Diagramming components for ASP.NET MVC and ASP.NET. We have added the following new useful features:

Styled text
The ShapeNode.EnableStyledText property allows using HTML-like formatting tags to apply various attributes to the node’s text. At this time the components support the following formatting tags:

  • <b> specifies bold text
  • <i> specifies italic text
  • <u> specifies underlined text
  • <color=value> specifies text color
  • <br /> specifies line break
Styled text in an ASP.NET/ASP.NET MVC diagram

Styled text in an ASP.NET/ASP.NET MVC diagram

Improved text rendering

  • We have gratly improved the general text rendering quality. The components now remove scale transformations applied for MeasureUnit and ZoomFactor before drawing text on the canvas, and instead specify a scaled font size, which helps improve text appearance in Firefox and older versions of Chrome.
  • You can draw the items’ text underlined. To enable this, set the underline attribute of the Font class.
  • Font styles can be specified via Style instance by setting its FontStyle property.

License keys

MindFusion no longer provides separate trial and licensed versions of its components. Instead, you should set the LicenseKey property to disable a component’s evaluation mode and stop displaying trial messages. If your application has more than one Diagram instance or other controls by MindFusion, a single call to MindFusion.Licensing.LicenseManager.AddLicense(key) is enough to specify the key for all the controls. You can find your license key strings listed on the Keys & Downloads page at your http://clientsarea.eu account.

Miscellaneous

  • You can draw items using dashed lines in browsers that support the setLineDash function. To enable this, set the Pen.DashStyle property of DiagramItem or the StrokeDashStyle property of Style.
  • Client-side TreeLayout supports organizational charts with assistant nodes as in Microsoft Office diagrams. You can mark nodes as assistants if you set node.LayoutTraits[TreeLayout.Assistant] to a member of the AssistantType enumeration. Set
    TreeLayout.enableAssistants = true; 
    

    to arrange assistant nodes in a separate branch between the main node levels.

  • Specify if separate connected components of a graph should be arranged horizontally or vertically relatively to each other by setting the multipleGraphsPlacement attribute of layout classes.
  • The type of LinkLabel.Margin property has been changed from number to Thickness, letting you specify different margin sizes at each side of the label.
  • Masters for Start and Arrow7 shapes are added to VisioExporter template file.
  • VisioImporter now tries to preserve ShapeNode.Shape when importing from files created by VisioExporter.

The trial versions of the controls are available for download from the links below:

Download MindFusion.Diagramming for ASP.NET, V5.4.1

Download MindFusion.Diagramming for ASP.NET MVC, V2.4

MindFusion support team is happy to assist you with any questions you might have about Diagramming for ASP.NET MVC, Diagramming for ASP.NET or any other of our products. You can leave a message at the discussion board, use the help desk or e-mail support@mindfusion.eu.. We strive to provide competent and detailed answers to your questions within hours of receiving them.

About Diagramming for ASP.NET Component: An advanced WebForms programming component that offers all the functionality that is needed for creating, styling and presenting attractive flowcharts, hierarchies, trees, graphs, schemes, diagrams and many more. The control offers numerous utility methods, path finding and cycle detection, rich event set and many useful user interaction features like tool tips, multiple selection, copy/paste to/from Windows clipboard and many more.

NetDiagram offers over 100 predefined node shapes, scrollable tables, 13 automatic layouts and many more. You can check the online demo to see some of the features in action. The control includes many samples, detailed documentation and step-by-step tutorials. Every features is duly documented and there’s plenty of code to copy. The component is not only powerful and scalable, but easy to learn and fun to use.

About Diagramming for ASP.NET MVC Control: It is a multi-purpose diagramming tool that consists of two parts: a .NET class library running on the server and a client side control implemented in JavaScript. The server side .NET library implements a flow-diagramming object model that lets you define structures such as trees, flowcharts and graphs. Every element in the diagram is easily accessible and the whole diagram is rendered as part of an HTML page by just calling the DiagramView extension method.

On the client the diagram is rendered by a DiagramView JavaScript control that draws its content on an HTML Canvas. The user is able to add nodes and links simply by drawing them with the mouse. There is also a NodeListView control, which lets users create new nodes via drag and drop.

MvcDiagram also supports various automatic layout algorithms that will make every diagram easy to understand and nice to look at. The diagram can also be easily serialized in binary or XML format. Exporting is done in a variety of formats including Pdf, Svg, Visio and more. You can read details about the components at the MvcDiagram features page.