MindFusion is happy to announce the new release of its WinForms reporting control. Here is an overview of the new features:
Support for Visual Studio 2015
MindFusion.Reporting now supports Visual Studio 2015 as well. You can tell the installer to create VS2015 toolbox palette for the component.
Licensing
There is no separate trial build of the control assemblies anymore. Instead, you must set the LicenseKey property of the component to disable the evaluation mode and stop displaying trial messages. If your application contains more than one control by MindFusion, you can call MindFusion.Licensing.LicenseManager.AddLicense(key) to specify the key once instead of setting it per each control. License key strings are listed on the Keys & Downloads page at MindFusion’s customer portal.
Barcodes
Use the new Barcode report item to display UPC-A, UPC-E, EAN-8, EAN-13, and QR barcodes in your WinForm reports. A new sample demonstrates how to implement the feature.
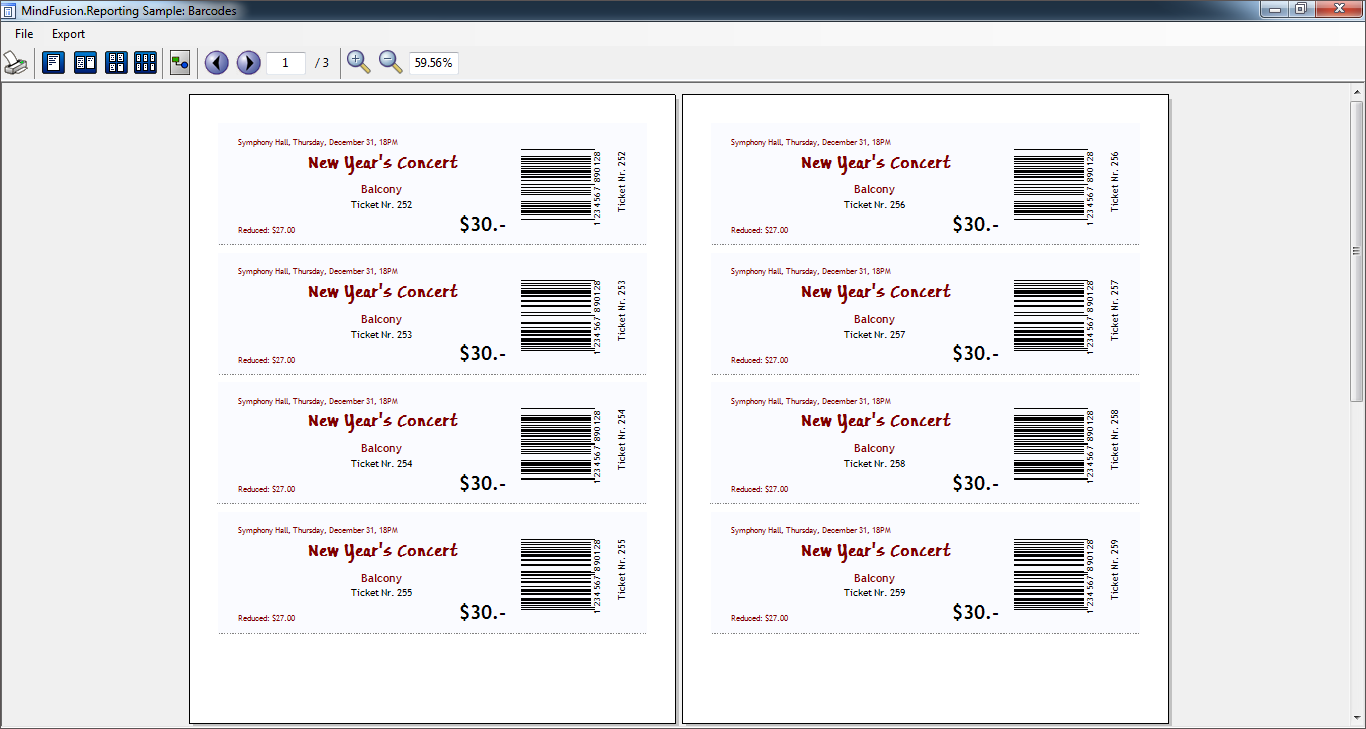
MindFusion WinForms Reporter: Bar Codes
The component is available for direct download from here:
Download MindFusion Reporter for WinForms, V2.3
Don’t forget that the reporting tool is also available on Nuget. To install the component, run the following command in the Package Manager Console:
PM> Install-Package MindFusion.Reporting
Additional information about the library can be found in the online documentation:
http://www.mindfusion.eu/onlinehelp/mindfusionreporting/index.htm
Technical support is available at the Reporting for WinForms section of MindFusion discussion board, at the Help Desk or per e-mail at support@mindfusion.eu. Either way, MindFusion competent and friendly support team is pleased to assist you with any questions or inquiries you might have about the product.
About Reporting for WinForms: Enhance your business application with the complete set of features to create impressive, user-friendly reports that present important data in an easy-to comprehend look. Enjoy the rich report design capabilities that let you integrate charts, customize fonts and use easy WinForms component as a report item.
Bind our report to any .NET data source or work in an unbound mode. Choose among various output options among which XML, PDF and HTML files. Get inspired, get moving – MindFusion Reporting for WinForms is designed and developed to help you acheive best possible results in little time and with little effort. Read more about the tool here…