Pie Chart with Custom Labels in WinForms

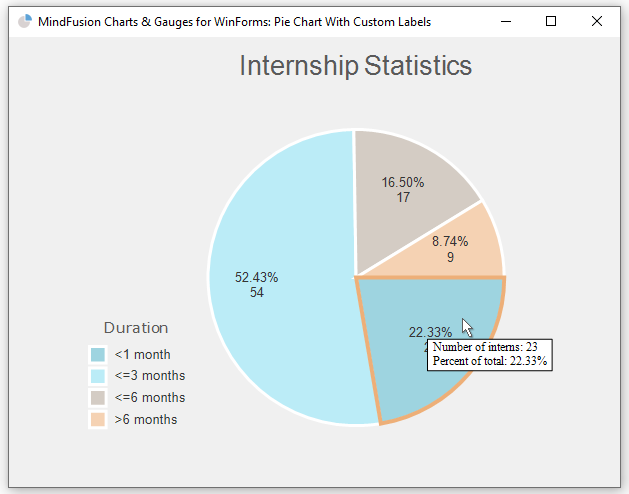
In this tutorial we will build the following pie chart using MindFusion Charts and Gauges for WinForms library:

This is a PieChart with a custom Series class that extends the capabilities of a standard PieSeries We need to create a custom Series class because we want the inner labels to follow a special format and we want the outer labels to be rendered as legend items not near pie pieces.

You can download the source code of the sample together with the MindFusion libraries used from the link at the bottom of the post.

I. General Setup

We create an empty WinForms application in C# with Visual Studio. We create a folder called References and there we copy the MindFusion.*.dll -s that we will need. They are:

MindFusion.Charting.dll
MindFusion.Charting.WinForms.dll
MindFusion.Common.dll

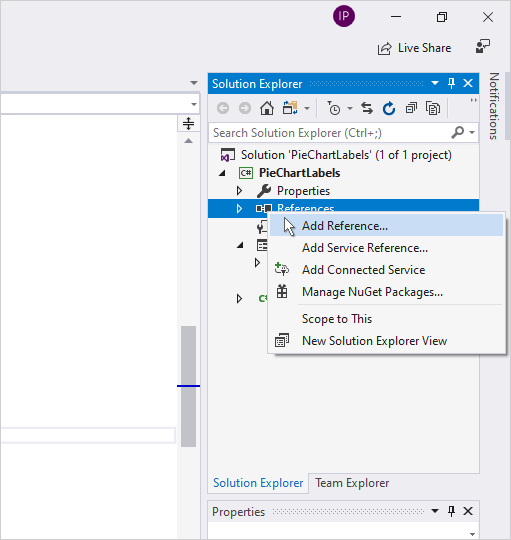
We reference those files in our project: we right-click the References folder in the Solution Explorer and click on “Add Reference”. Then we browse to our local References folder and add the 3 dll-s.

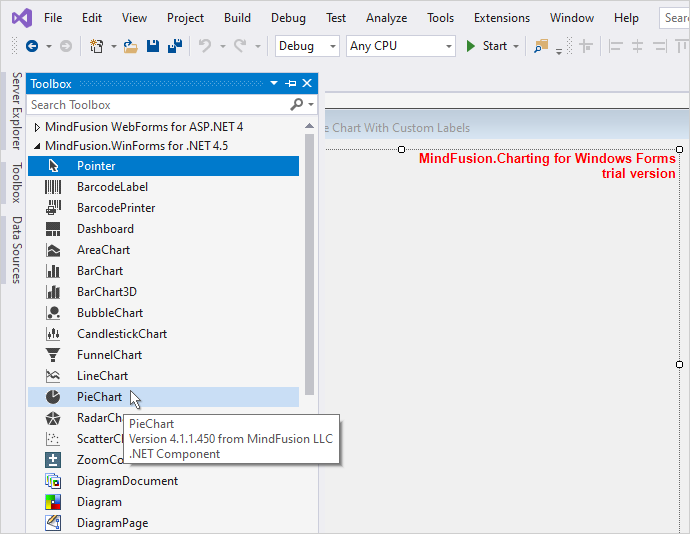
We have installed MindFusion Charts and Gauges from the website: http://mindfusion.eu/ChartWinFormsTrial.zip and now we need only to find the PieChart control, drag and drop it onto the WinForms Form of our application.

II. The Custom Pie Series

When you create a custom series you need to implement the Series interface. You need to declare several methods and properties, and one event. Let’s start with the constructor.

We need our chart to use one array with data and one array with labels. We declare two class variables for that and assign to them the values that we receive for them in the constructor. We name the new class CustomPieSeries:

public class CustomPieSeries : Series
{
	public CustomPieSeries(IList data, IList legendLabels )
	{
		values = data;		
		_legendLabels = legendLabels;

		//sum up all pie data
		total = 0.0;
		for (int i = 0; i < data.Count; i++)
			total += data[i];
	}

	IList values;	
	IList _legendLabels;
        double total = 0L;
}

We have added a new class variable called total. It is needed to keep the sum of all data for the chart. We will use this variable when we calculate the percent value of each pie piece.

The SupportedLabels property of type LabelKinds is the way to set which labels will be rendered by the new series. We want tooltips, inner labels and legend labels. There is no special enum field for legend labels. You just set which labels form the series should be rendered as legend items. We decide to use for this the ZAxisLabel, because it is not drawn anywhere on the pie chart and we won’t see it doubled by the legend labels. So, we say that the chart supports ZAxisLabels and we will tell the series that the ZAxisLabels must be rendered in the legend. We will do this later.

public LabelKinds SupportedLabels
{
	get { return LabelKinds.InnerLabel | LabelKinds.ToolTip | LabelKinds.ZAxisLabel; }
}

The GetLabel method is the place where we must return the correct label according to the type and position of the label, which are provided as arguments.

public string GetLabel(int index, LabelKinds kind)
{
	double percent = (values[index] / total) * 100;
	if (kind == LabelKinds.InnerLabel)
		return percent.ToString("F2") + "%\n" + values[index].ToString();
	if (kind == LabelKinds.ToolTip)
		return "Number of interns: " + values[index].ToString("F0") + 
			"\nPercent of total: " + percent.ToString("F2") + "%";

	if (kind == LabelKinds.ZAxisLabel)
		return _legendLabels[index].ToString();

	return null;
}

Here we have the chance to work over the raw data that we have for the series and return the desired labels as a string. We want the inner label to appear as the data value together with its percent representation. We calculate the percent thanks to the total variable and format it in an appropriate way:

 if (kind == LabelKinds.InnerLabel)
	return percent.ToString("F2") + "%\n" + values[index].ToString();

We do the same with the tooltips. We add an explanation text to the tooltip of each piece:

if (kind == LabelKinds.ToolTip)
	return "Number of interns: " + values[index].ToString("F0") + 
		"\nPercent of total: " + percent.ToString("F2") + "%";

The ZAxisLabel is the easiest to do. It will be used by the legend and we perform no special formatting upon it – we just return the label corresponding to the given index.

if (kind == LabelKinds.ZAxisLabel)
		return _legendLabels[index].ToString();

Among the other notable members of the Series interface are the Dimensions and Title properties. Dimensions is the property that specifies how many data dimensions the series has. They are 1 for charts that use one array of data, 2 for axes that use X and Y data, and 3 for 3D charts, which need X, Y and Z data. In our case we return 1 as property value because pie charts, just like radar charts, use only one data array.

public int Dimensions
{
	get { return 1; }
}

The Title property returns the Series title. This is an important property but in our case we will not use it. A common use case for Title is to be rendered in legends. We will not render the Series title in the legend, so we return an empty string.

public string Title
{
	get { return ""; }
}

Building the CustomPieSeries is an easy task:

var values = new List { 23, 54, 17, 9 };
pieChart1.Series = new CustomPieSeries(
	values,				
	new List()
	{
		" <1 month", " <=3 months", " <=6 months", " >6 months"
	}
);

We create a new instance of our new class and assign it to the Series property of the PieChart control. We provide a list with the data and the labels that we want to appear as a legend.

III. The Legend

The legend in the PieChart control is regulated by the LegendRenderer property. We set the ShowSeriesElements property to true to let the chart know that we want the data from the series to be rendered as labels and not the title:

pieChart1.LegendRenderer.ShowSeriesElements = true;

Then we use the ElementLabelKind property to specify which labels we want to use in the legend. These are the ZAxisLabels:

pieChart1.LegendRenderer.ElementLabelKind = LabelKinds.ZAxisLabel;

The other properties are self-explanatory. We use the Title property to set the legend title and set a transparent brush for both the Background and the BorderStroke = “Duration”;

pieChart1.LegendRenderer.Background = new SolidBrush(Color.Transparent);
pieChart1.LegendRenderer.BorderStroke = new SolidBrush(Color.Transparent);

IV. Styling

Styling the chart is done through the Theme property and through styles. There are different style classes available and in our case we will use the PerElementSeriesStyle class. This class accepts as arguments for the brushes and strokes lists with lists that contain the brushes. Then, it colors each element in each series with the corresponding brush in the array at the corresponding index. Our PieChart needs just one list with brushes and strokes. The stroke thicknesses are also added as nested arrays:

pieChart1.Plot.SeriesStyle = new PerElementSeriesStyle()
{
	Fills = new List<List>()
	{
		new List()
		{
			new SolidBrush(Color.FromArgb(158, 212, 224)),
			new SolidBrush(Color.FromArgb(187, 236, 247)),
			new SolidBrush(Color.FromArgb(212, 204, 196)),
			new SolidBrush(Color.FromArgb(245, 210, 179))					         }
	},

	Strokes = new List<list>()
	{
		new List()
		{
			new SolidBrush(Color.White)
						
		}
	},
	StrokeThicknesses = new List<list>()
	{
		new List()
		{
			3.0
		}
	}
};

We also set some appearance properties through the Theme field:

pieChart1.Theme.DataLabelsFontSize = 10;
pieChart1.Theme.HighlightStroke = new SolidBrush(Color.FromArgb(237, 175, 120));
pieChart1.Theme.HighlightStrokeThickness = 4;

The HighlightStroke is used to mark the selected chart element by mouse hover. The DataLabelsFontSize is used not only by painting the inner labels but also by painting the labels in the legend.

Finally we set the Title of the chart:

pieChart1.Title = "Internship Statistics";

And that is the end of this tutorial. You can download the code for the chart together with the MindFusion.*.dll libraries used from this link:

Pie Chart with Custom Labels Source Code Download

You can refer to MindFusion helpful support team with any technical questions regarding the WinForms Charts & Gauges control. Use the forum at: https://mindfusion.eu/Forum/YaBB.pl?board=mchart_disc

About MindFusion Charts and Gauges for WinForms: MindFusion Charts and Gauges for WinForms offers a long list of features that enables developer to build any type of chart, gauge or dashboard. The smart API of the library provides the option different chart elements like plots, axes, labels, and series to be combined and arranged in order to build any type of custom looking chart. The library also supports out of the box the most common chart types together with a set of their widely used properties. The gauge control is indispensable part of the library and offers a linear and oval gauge together with a variety of samples that provide you with the most common types of gauges used: clock, compass, thermometer, car dashboard and more. More about MindFusion Charts and Gauges for WinForms at: https://mindfusion.eu/winforms-chart.html.

Combo Chart with the Free JS Chart Library

MindFusion Free Js Chart is a charting library that enables you to create and customize the most popular chart types in pure JavaScript. The library is free for commercial use. No attribution is required.

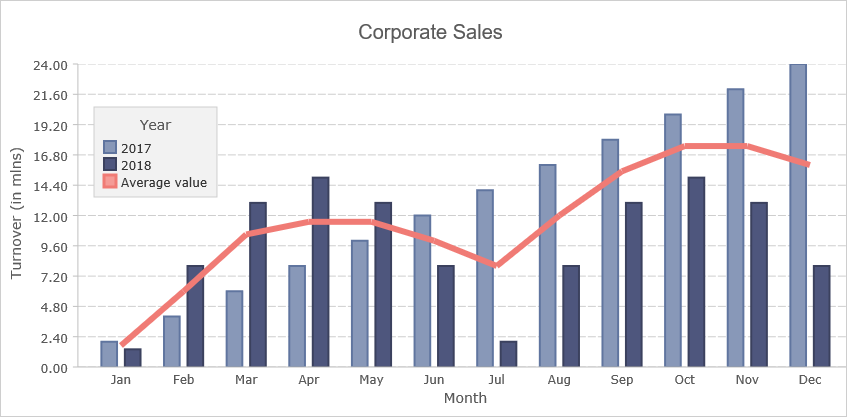
Here we will take a brief look at the steps you need to take to build this beautiful combo chart from scratch.

I. Setup

The chart needs an HTML Canvas element to render onto and we create one in our web page:

<canvas id="combiChart" width="400" height="400"></canvas>

It is important to provide an id to the Canvas element, because we will reference it from the JavaScript code.

We also need to reference the two JavaScript libraries that provide the charting functionality:

<script type="text/javascript" src="Scripts/MindFusion.Common.js"></script>
<script type="text/javascript" src="Scripts/MindFusion.Charting.js"></script>

And we add a reference to another JavaScript file, that will hold the code for the combo chart:

<script type="text/javascript" src="CombiChart.js"></script>

II. Chart Settings

We create the chart control using the HTML Element of the Canvas:

var chartEl = document.getElementById('combiChart');
chartEl.width = chartEl.offsetParent.clientWidth;
chartEl.height = chartEl.offsetParent.clientHeight;

var chart = new Controls.BarChart(chartEl);

We create a bar chart, to which we will add line rendering capabilities. It is also possible to create a line chart and add rendering of bars to it.

Next, we add a title and a grid to the chart:

chart.title = "Corporate Sales";
chart.titleMargin = new Charting.Margins(0, 20, 0, 20);
chart.gridType = GridType.Horizontal;
chart.barSpacingRatio = 1.5;

The barSpacingRatio indicates how much free space will be left between the group of bars relative to the bar width.

III. Chart Series

We create two series for the bars. Free JS Chart offers a variety of series types to choose from and we use two different series for the bars. The first one is BarSeries We use it because it supports setting the X-labels by default:

var labels = new Collections.List([
	"Jan", "Feb", "Mar", "Apr", "May", "Jun",
	"Jul", "Aug", "Sep", "Oct", "Nov", "Dec"
]);

var series1 = new Charting.BarSeries(new Collections.List([2, 4, 6,  8, 10, 12, 14, 16, 18, 20, 22, 24]), null, null, labels);

The other series of type SimpleSeries – it needs only two parameters – a list with the data and a list with the labels:

var series2 = new Charting.SimpleSeries(new Collections.List([1.4, 8, 13, 15, 13, 8, 2, 8, 13, 15, 13, 8]), null);

We don’t have labels, so we set null. Then we add the series to a collection:

var series = new Collections.ObservableCollection(new Array(series1, series2));
chart.series = series;

and assign the collection to the series property of the chart. We create the line series as an instance of the Series2D class:

//the line series
var series3 = new Charting.Series2D(new Collections.List([0, 1, 2, 3, 4, 5, 6, 7, 8, 9, 10, 11]), new Collections.List([1.7, 6, 10.5, 11.5, 11.5, 10, 8, 12, 15.5, 17.5, 17.5, 16]), null);
series3.title = "Average value";
var lseries = new Collections.ObservableCollection(new Array(series3));

We add it to another collections.

The chart renders by default bars. We will make it render a line series with the help of a LineRenderer We create an instance of the LineRenderer class and provides it with the collection of series that we want to appear as lines. In our case it is just one:

//add a renderer for the line series
var lRenderer = new Charting.LineRenderer(lseries);
lRenderer.seriesStyle = new Charting.UniformSeriesStyle(lbrush, lstroke, 6);
chart.plot.seriesRenderers.add(lRenderer);

Each chart has a plot and the plot has a SeriesRenderer property that holds all renderers for the chart data. By default, a bar chart has a BarRenderer Now we add to this collection the LineRenderer that will draw the series in lseries as lines.

IV. Legend

The chart legend is rendered when showLegend is set to true:

//legend settings
chart.showLegend = true;
chart.legendMargin = new Charting.Margins(10, 10, 10, 10);
chart.legendTitle = "Year";

We set the title of the legend to be “Year” and add some margin. The labels of the legend are taken from the title property of each Series Since the series are rendered by two different renderers we need to tell the legend which are the renders so it can take the labels from both of them and not only from the bar series. This is done with the content property of the legendRenderer:

chart.legendRenderer.content = chart.plot.seriesRenderers;

V. Styling

The styling of the Series is done with different Style instances. For the bar chart we use a PerSeriesStyle instance. It colors all elements of a given series with the respective brush and stroke in the brushes and strokes instances that were provided as parameters:

var firstBrush = new Drawing.Brush("#8898B8");
var secondBrush = new Drawing.Brush("#4E567D");
var firstStroke = new Drawing.Brush("#60759f");
var secondStroke = new Drawing.Brush("#3b415e");

 // assign one brush per series
var brushes = new Collections.List([firstBrush, secondBrush]);
var strokes = new Collections.List([firstStroke, secondStroke]); 
chart.plot.seriesStyle = new Charting.PerSeriesStyle(brushes, strokes);

We assign this style to the seriesStyle property of the plot. The line series is colored with an instance of the UniformSeriesStyle class. It applies one brush and one stroke to all elements in all series:

var lbrush = new Drawing.Brush("#F49B96");
var lstroke = new Drawing.Brush("#f07b75");

//add a renderer for the line series
var lRenderer = new Charting.LineRenderer(lseries);
lRenderer.seriesStyle = new Charting.UniformSeriesStyle(lbrush, lstroke, 6);

The third argument indicates the stroke thickness. Note that now we assign the new style to the seriesStyle property of the LineRenderer rest of the settings for the chart appearance are in the theme property:

//theme settings for customizing the chart's appearance
chart.theme.legendBackground = new Drawing.Brush("#f2f2f2");
chart.theme.legendTitleFontSize = 14;
chart.theme.legendBorderStroke = new Drawing.Brush("#cecece");

chart.theme.axisTitleFontSize = 14;
chart.theme.axisLabelsFontSize = 12;
chart.theme.axisTitleFontName = "Verdana";
chart.theme.axisLabelsFontName = "Verdana";

chart.theme.dataLabelsFontName = "Verdana";
chart.theme.dataLabelsFontSize = 12;

chart.theme.gridLineStyle = Drawing.DashStyle.Dash;
chart.theme.gridColor1 = chart.theme.gridColor2 = new Drawing.Color("#ffffff");
chart.theme.gridLineColor = new Drawing.Color("#cecece");

chart.theme.highlightStroke = new Drawing.Brush("#F49B96");
chart.theme.highlightStrokeThickness = 4;

Here we change the font for the labels, style the legend and the grid. Finally, we customize the stroke that highlights chart elements when the user hovers with the mouse over them.

And that’s the end of this tutorial. You can download the full source code of the sample with the libraries of Free JS Chart from this link: https://mindfusion.eu/samples/javascript/free_chart/CombiChart.zip

You can find out more about MindFusion Free JS Chart library at https://mindfusion.eu/free-js-chart.html.

New Release for the Free JS Chart Library

MindFusion Free JS Chart has a new release with the following new features:

– All Series can accept now simple JavaScript array-s as arguments instead of Collections.List instances
– The ToolTip class is greatly extended with many new properties that allow you to customize the apparance and position of tooltips
– The Color.knownColors field lists all standard CSS color names
– Brush and Pen instances can be created with simple strings that specify the HTML code of the color as argument instead of Color objects.
– The yLabelAlignment property of BiaxialChart specifies horizontal alignment of Y-axis labels.
– Texts are now properly underlined when FontStyle.Underline is set.

Free JS Chart is MindFusion charting library that is offered free of charge for commercial use. No attribution is required.

More about MindFusion Free JS Chart at https://mindfusion.eu/free-js-chart.html

Combination Chart in JavaScript

In this blog post we will use the Charting for JavaScript library to create the chart that you see below:

This is a combination chart has one line series and two bar series drawn in stacks. We will use the Dashboard control to combine the building elements of the chart: data series, legend, axes, title and plot.

I. HTML Setup

We need an HTML Canvas element for the chart to draw itsself onto. It is important that we give it an id. The Canvas element will render the chart and its position and size will determine where and how big the chart will be drawn.

<canvas id="dashboard" style="width: 100%; height: 100%; display: block;"></canvas>

The Dashboard control needs the MindFusion.Charting.js library. We also need the MindFusion.Drawing module for presentation classes like brushes, pens etc. We include reference to these files at the end of the web page, before the closing BODY tag:

<a href="http://Scripts/MindFusion.Common.js">http://Scripts/MindFusion.Common.js</a>
<a href="http://Scripts/MindFusion.Charting.js">http://Scripts/MindFusion.Charting.js</a>

The two library JavaScript files are in a subfolder called Scripts. We prefer to keep the JavaScript code for the combination chart separate from the web page and we include one final JS reference:

<a href="http://CombinationChart.js">http://CombinationChart.js</a>

This is the code-behind file where we will write all code that creates and customizes the combination chart.

II. Creating the Dashboard and General Chart Settings

We add mappings to the chart and drawing namespaces that we want to use. If your IDE supports Intellisense you can also add a reference to the Intellisense file.

/// 
var Charting = MindFusion.Charting;

var Controls = Charting.Controls;
var Collections = Charting.Collections;
var Drawing = Charting.Drawing;
var Components = Charting.Components;

The Dashboard class requires and HTML element in the constructor. We get the Canvas from the web page with the help of its id:

// create the dashboard
var dashboardEl = document.getElementById('dashboard');
dashboardEl.width = dashboardEl.offsetParent.clientWidth;
dashboardEl.height = dashboardEl.offsetParent.clientHeight;
var dashboard = new Controls.Dashboard(dashboardEl);

The Dashboard control is a container for all elements of a dashboard. In order to render a chart, we need a Plot element that can visualize data. We create an instance of the Plot2D class:

var plot = new Charting.Plot2D();
plot.gridType = Charting.GridType.Horizontal;
plot.gridColor1 = plot.gridColor2 = new Drawing.Color.fromArgb(200, 243, 244, 254);

Then we specify that the plot will render a horizontal grid with light gray grid lines. Each Plot2D has a seriesRenderers property that stores all -SeriesRenderer -s that are responsible for drawing correctly the data series according to their type – LineSeries BarSeries PieSeries etc. More about that later.

III. Data Series and Renderers

Each data series is represented by a class that corresponds to its type. MindFusion Charting for JavaScript has a variety of ISeries classes, some of whom can be used in different chart types. We will first use the BarSeries class to create one of the series that render bars:

// data for first bar series
var barSeries1 = new Charting.BarSeries(
		new Collections.List([9, 11, 13, 18, 19, 22, 23, 26, 29, 32, 33, 36, 41, 46, 49, 55, 57, 58, 61, 63]), //y
		null, null,
		new Collections.List(["1999", "2000", "2001", "2002", "2003", "2004", "2005", "2006", "2007", "2008", "2009", "2010", "2011", "2012", 
		"2012", "2013", "2014", "2015", "2016", "2017", "2018"]));

The BarSeries constructor requires several arguments. The first one is the data list, the second are lists with the top and inner labels, which we do not use. The last parameter are the labels for the X-axis and we set here the desired labels.

Then we set the title property of the BarSeries – it is important because it will render as a legend item.

barSeries1.title = "Total amount of goods sold";

We create then another series for the top row of bars. We don’t need any labels any more so we use now a simple Series2D instance:

var barSeries2 = new Charting.Series2D(
		new Collections.List([1, 2, 3, 4, 5, 6, 7, 8, 9, 10, 11, 12, 13, 14, 15, 16, 17, 18, 19, 20]),//x
		new Collections.List([3, 4, 5, 5, 7, 8, 7, 6, 8, 15, 17, 21, 19, 18, 17, 16, 17, 19, 20, 22]),//y
		null);

barSeries2.title = "Extra production to meet demand";

The series need a SeriesRenderer that can draw them. There are different SeriesRenderer -s for the different types of series. The different SeriesRenderer instances support different ISeries classes.

In our case we want a stack bar chart and we use the BarStackRenderer . Each SeriesRenderer accepts a list with the Series instances it must render. Here is the code for the stack bars:

// draw bars
var barRenderer = new Charting.BarStackRenderer(new Collections.ObservableCollection([barSeries1, barSeries2]));
barRenderer.seriesStyle = new Charting.PerSeriesStyle (new Collections.List([new Drawing.Brush("#230A59"), new Drawing.Brush("#3E38F2")]));
barRenderer.barSpacingRatio = 0.7;

The different SeriesRenderer instances have different sets of properties that allow you to customize how the data series will be drawn. Here we use the barSpacingRatio to specify the thickness of the stack bars.

As we mentioned earlier, the Plot2D class has a seriesRenderers property where we can add the different SeriesRenderer -s that we want to show. We add the BarStackRenderer add graphics to plot
plot.seriesRenderers.add(barRenderer);

The procedure is the same for the line chart. We create another Series2D instance:

// sample data for line graphics
var lineSeries = new Charting.Series2D(
				new Collections.List([0, 1, 2, 3, 4, 5, 6, 7, 8, 9, 10, 11, 12, 13, 14, 15, 16, 17, 18, 19]),//x
				new Collections.List([7, 9, 12, 15, 18, 23, 24, 27, 35, 41, 46, 49, 53, 55, 58,  61, 63, 66, 67, 69 ]),//right-y
				null);
lineSeries.title = "Peak demand";

We give it a title and create a LineRenderer that will render this series:

// draw lines
var lineRenderer = new Charting.LineRenderer(
				new Collections.ObservableCollection([lineSeries]));
lineRenderer.seriesStyle = new Charting.UniformSeriesStyle(new Drawing.Brush("#ffffff"), new Drawing.Brush("#ffffff"), 6);

Finally we add the LineRenderer to the seriesRenderers collection of the Plot2D instance.

plot.seriesRenderers.add(lineRenderer);

You might have noticed that we also set the seriesStyle property in both the BarStackRenderer and the LineRenderer classes. This is the property that specifies how the chart series will be painted. There are different classes that derive from SeriesStyle All of them concern a different pattern of applying brushes and pens to the element of a Series We use here an instance of the PerSeriesStyle class that accepts lists with brushes and strokes and applies one consequtive brush and stroke to all elements in the corresponding Series . The LineRenderer uses the UniformSeriesStyle , which accepts just two Brush instances as arguments and applies them to fill and stroke all elements in all Series instances in the SeriesRenderer .

IV. The Axes

The chart axes are instances of the Axis class. We use their min , max and interval properties to specify the numeric data of each of the two axes that our dashboard will have – X and Y:

// create axes
var xAxis = new Charting.Axis();
xAxis.interval = 0;
xAxis.minValue = -1;
xAxis.maxValue = 20;
xAxis.title = "";

// create axes
var yAxis = new Charting.Axis();
yAxis.interval = 10;
yAxis.minValue = 0;
yAxis.maxValue = 100;
yAxis.title = "Cost of goods in mlns of USD";

Then we specify to the Plot2D that the Axis instances we created are its X and Y axes:

plot.yAxis = yAxis;
plot.xAxis = xAxis;

As you might have guessed, the Axis need Renderer-s to render them. They are called respectively XAxisRenderer and YAxisRenderer .

// create renderers for the two axes
var xAxisRenderer = new Charting.XAxisRenderer(xAxis);
xAxisRenderer.margin = new Charting.Margins(0, 0, 0, 10);
xAxisRenderer.labelsSource = plot;
xAxisRenderer.showCoordinates = false;


var yAxisRenderer = new Charting.YAxisRenderer(yAxis);
yAxisRenderer.margin = new Charting.Margins(10, 0, 0, 0);

The renderers have various properties for specifying how the axes will be rendered. We use margin to add some space around the two axes.

Finally, we use the layoutBuilder property of the Dashboard class to create a GridPanel that will correctly measure and arrange all building blocks of our cobination chart:

dashboard.layoutBuilder.createAndAddPlotAndAxes(
		plot, null,
		[yAxisRenderer],
		[ xAxisRenderer ],
		null);

V. The Legend

As we said, the legend items are taken from the title property of each Series . We use a LegendRenderer to render the legend and set some of its properties:

// add legend
var legendRenderer = new Charting.LegendRenderer();
legendRenderer.content = new Collections.ObservableCollection([barRenderer, lineRenderer]);
legendRenderer.background = new Drawing.Brush("#d0d3fb");
legendRenderer.borderStroke = new Drawing.Brush("#BDBFAA");
legendRenderer.showTitle = false;
legendRenderer.horizontalAlignment = Components.LayoutAlignment.Far;

The content property of LegendRenderer allows us to specify a collection of SeriesRenderer instances. This way we can have one legend for series of different kinds. We don’t need a title for our legend, so we set showTitle to false.

The LegendRenderer requires no special positioning in the dashboard layout, so we simple add it to the rootPanel of the Dashboard and let it handle its easure and placement:

dashboard.rootPanel.children.add(legendRenderer);

VI. The Title and Subtitle

The title is an instance of the TextComponent class:

var tc = new Components.TextComponent();
tc.text = "STEADY GROWTH";
tc.fontSize = 20.4;
tc.horizontalAlignment = Components.LayoutAlignment.Near;
tc.margin = new Charting.Margins(100, 10, 0, 0);
dashboard.layoutPanel.children.add(tc);

It has various appearance properties. Just like the LegendRenderer the TextComponent can be added directly to the children of the layoutPanel.

Now that we’ve made all arrangements for the chart let’s not forget to call the draw method that will render the chart on the screen:

dashboard.draw();

That was everything. You can see an online demo of the chart here.

You can download the full source code of this combination chart in JavaScript together with all used libraries from here:

Combination Chart in JavaScript Full Code

About Charting for JavaScript: MindFusion library for interactive charts and gauges. It supports all common chart types including 3D bar charts. Charts can have a grid, a legend, unlimitd number of axes and series. Scroll, zoom and pan are supported out of the box. You can easily create your own chart series by implementing the Series interface.
The gauges library is part of Charting for JavaScript. It supports oval and linear gauge with several types of labels and ticks. Various samples show you how the implement the gauges to create and customize all popular gauge types: car dashboard, clock, thermometer, compass etc. Learn more about Charting and Gauges for JavaScript at https://mindfusion.eu/javascript-chart.html.

Multi Series Line Chart With Custom ToolTips in JavaScript

In this blog post we will build a line chart with 4 different series and custom labels on both axes. The chart renders tooltips with custom formatting. You can see the chart online here:

I. Initial Setup

We start by creating a blank HTML page and there we initialize the HTML Canvas element that will be needed by the Js Chart library.

<canvas id="chart" style="width: 100%; height: 100%; display: block;">

You can initialize the canvas as you want – there are no special requirements as to the size, position, scroll settings or anything else. What is important is that you add an id for that canvas – it will be used by the chart library. At the bottom of the page, right before the closing BODY tag we add a reference to the charting JavaScript files that represent the chart library:

<script type="text/javascript" src="Scripts/MindFusion.Common.js"></script>
<script type="text/javascript" src="Scripts/MindFusion.Charting.js"></script>

We also add a reference to another JavaScript file called LineChartTooltips.js. We haven’t created it yet, but this will be the file that will hold the JavaScript code for our chart.

<script type="text/javascript" src="LineChartTooltips.js">

II. Initializing the Line Chart In the LineChartTooltips JavaScript file we first include a reference to the Intellisense file so we can use code completion.

/// <reference path="Scripts/jspack-vsdoc.js"></reference>

Then we add mappings to the namespaces that we want to use:

var Controls = Charting.Controls;
var Collections = Charting.Collections;
var DateTimeSeries = Charting.DateTimeSeries;
var Drawing = Charting.Drawing;
var ToolTip = Charting.ToolTip;

Now we create the JavaScript chart object. We need a reference to the HTML canvas element, which we get using its id:

var chartEl = document.getElementById('chart');
chartEl.width = chartEl.offsetParent.clientWidth;
chartEl.height = chartEl.offsetParent.clientHeight;

We use the clientWidth and clientHeight properties of the offsetElement for the chart to give the chart its size.

Next we create the LineChart control and set its title and subtitle.

// create the chart
var lineChart = new Controls.LineChart(chartEl);
lineChart.title = "Women as a percentage in all S&E occupations";
lineChart.subtitle = "1993-2010";

III. Labels

The labels for the X and Y axes are set with two lists:

var xlabels = new Collections.List([
    "1993", "1995", "1997", "1999", "2003", "2006",
    "2008", "2010"]);

var ylabels = new Collections.List([
    "0%", "10%", "20%", "30%", "40%", "50%",
    "60%", "70%"]);

By default the labels at the axes are the intervals. We can replace them with the labels of a given chart series by using the supportedLabels property. This property tells the control at which chart element the labels of the series should be rendered – X or Y axis, tooltip, data labels etc. The members are from the LabelKinds enumeration.

The LineChart control uses series that support X and Y values. The best match is the Series2D class. This class supports one list with labels, which are always drawn at the data points. The easiest thing for us to do is to customize the Series2D and make it accept two lists with labels, which we will show them on both axes. Here is how we create the custom class by inheriting from Series2D

SeriesWithAxisLabels = function (xValues, yValues, xLabels, yLabels) {
    this.yLabels = yLabels;
    Charting.Series2D.apply(this, [xValues, yValues, xLabels]);
};

SeriesWithAxisLabels.prototype = Object.create(Charting.Series2D.prototype);

Our custom class is called SeriesWithAxisLabels. It accepts two lists with labels in the constructor. With one of them we call the constructor of the base class. The other we assign to a new property called yLabels.

Now we need to override the getLabel method and return the right label for the X and Y axis.

SeriesWithAxisLabels.prototype.getLabel = function (index, kind) {
    if ((kind & Charting.LabelKinds.XAxisLabel) != 0 && this.labels)
        return this.labels.items()[index];

    if ((kind & Charting.LabelKinds.YAxisLabel) != 0 && this.yLabels)
        return this.yLabels.items()[index];
   
    return "";
};

The getLabel method is responsible for providing the correct label according to the kind of labels that is requested. Here we check if we are asked for a label at the X or Y axis and return the label with the correct index from the xLabels or yLabels arrays. Here is how we create that series, which serves only to provide labels for the axes:

var series0 = new SeriesWithAxisLabels(
    new Collections.List([1, 2, 3, 4, 5, 6, 7, 8]),
    new Collections.List([0, 10, 20, 30, 40, 50, 60, 70]),
    xlabels, ylabels
);
series0.supportedLabels = Charting.LabelKinds.XAxisLabel | Charting.LabelKinds.YAxisLabel;
lineChart.series.add(series0);

Note that the data for the X and Y values of series0 corresponds to the positions on the axes where the labels should be rendered.

IV. Data

The data for the chart is provided by two series. They are also of type Series2D However, we do not want them to render the labels at the data points, which is their default behaviour. We would customize once again the Series2D class and make the labels be used for tooltips and not the data points.

We define a new SeriesWithToolTip class that overrides Series2D

SeriesWithToolTip = function (xValues, yValues, labels) { 
    Charting.Series2D.apply(this, [xValues, yValues, labels]);
};

SeriesWithToolTip.prototype = Object.create(Charting.Series2D.prototype);

The difference is the getLabel method. When asked for a label for the tooltip it returns the label at the given position from the series’ labels list:

SeriesWithToolTip.prototype.getLabel = function (index, kind) {
    if ((kind & Charting.LabelKinds.ToolTip) != 0 && this.labels)
        return this.labels.items()[index];   

    return Charting.Series2D.prototype.getLabel.apply(this, [index, kind]);
};

We create a data series from the SeriesWithToolTip kind this way:

//first series
var series1 = new SeriesWithToolTip(
    new Collections.List([1, 2, 3, 4, 5, 6, 7, 8]),
    new Collections.List([21.3, 21.5, 21.7, 23, 26.3, 26.1, 26.3, 27.5])
);

series1.title = "All S&E occupations";
var tooltips = new Collections.List();

for (let step = 0; step < series1.yData.count(); step++) {
    tooltips.add(series1.title + " for " + xlabels.items()[step] + ": " +
        series1.yData.items()[step] + "%");
}
series1.labels = tooltips;
series1.supportedLabels = Charting.LabelKinds.ToolTip;
lineChart.series.add(series1);

We generate the tooltip in a list, because we want the text to combine data from the xLabels and its yData list.

V. Styling the Chart

the JavaScript Chart library supports several styles to be applied on the chart depending on what you want to achieve. In our case the best choice is the PerSeriesStyle class, which colours all the elements of a Series with the subsequent brush from its strokes and fills collections.

// create line brushes
var firstBrush = new Drawing.Brush("transparent");
var secondBrush = new Drawing.Brush("#EA3F36");
var thirdBrush = new Drawing.Brush("#1A3D95"); 
var fourthBrush = new Drawing.Brush("#717173");
var fifthBrush = new Drawing.Brush("#407D39");

var style = new Charting.PerSeriesStyle();
style.fills = style.strokes = new Collections.List([firstBrush, secondBrush, thirdBrush, fourthBrush, fifthBrush]);
style.strokeDashStyles = new Collections.List([Drawing.DashStyle.Dash, Drawing.DashStyle.Dash,
Drawing.DashStyle.Dash, Drawing.DashStyle.Dash, Drawing.DashStyle.Dash]);
style.strokeThicknesses = new Collections.List([2, 2, 2, 2, 2]);
lineChart.plot.seriesStyle = style;

The PerSeriesStyle class also provides us with properties to specify the DashStyle and the strokeThickness of the brushes.

The styling of the axes and the fonts is done via the properties of the Theme class. Each chart has a theme property of type Theme. You can use it to customize many properties of the chart:

lineChart.legendTitle = "";
lineChart.gridType = Charting.GridType.Horizontal;
lineChart.theme.axisTitleFontSize = 14;
lineChart.theme.axisLabelsFontSize = 12;
lineChart.theme.subtitleFontStyle = Charting.Drawing.FontStyle.Bold;
lineChart.theme.titleFontStyle = Charting.Drawing.FontStyle.Bold;
lineChart.theme.subtitleFontSize = 16;
lineChart.theme.dataLabelsFontSize = 12;

Note the dataLabelsFontSize property here. It regulates the font not only for the data labels but for the labels of the legend. That is why we set it, though we do not render data labels. There are several dataLabels properties like dataLabelsFontName, which customize different aspects of the labels at chart series and legend.

VI. Legend

You can show the legend with showLegend property, which is true by default. The legendTitle property sets the title of the legend, which we set to an epty string. The labels for each series are taken from the series’ title property:

lineChart.legendTitle = "";

series1.title = "All S&E occupations";
.................
series2.title = "Computer/mathematical scientists";
..................
series3.title = "Engineers";

We can customize the background and border of the legend through properties of the theme or the LegendRenderer:

lineChart.legendRenderer.background = new Drawing.Brush("#f2f2f2");
lineChart.legendRenderer.borderStroke = new Drawing.Brush("#c0c0c0");

VII. ToolTips

The tooltips are automatically rendered when the user hovers over a data point. We make the data points visible by setting showScatter to true:

lineChart.showScatter = true;

Then we set different properties of the TooltTip class to achieve the desired look of the tooltips:

ToolTip.brush = new Drawing.Brush("#fafafa");
ToolTip.pen = new Drawing.Pen("#9caac6");
ToolTip.textBrush = new Drawing.Brush("#717173");
ToolTip.horizontalPadding = 6;
ToolTip.verticalPadding = 4;
ToolTip.horizontalOffset = -6;
ToolTip.verticalOffset = -4;
ToolTip.font = new Charting.Drawing.Font("Arial", 12, Charting.Drawing.FontStyle.Bold);

The ToolTip class is a static class and we can set the properties directly.

At the end, we should always call draw() to see the chart correctly rendered on the screen:

lineChart.draw();

You can download the sample with the JavaScript chart libraries and the Intellisense file from this link:

https://mindfusion.eu/samples/javascript/chart/JsLineChartTooltips.zip

About Charting for JavaScript: MindFusion library for interactive charts and gauges. It supports all common chart types including 3D bar charts. Charts can have a grid, a legend, unlimitd number of axes and series. Scroll, zoom and pan are supported out of the box. You can easily create your own chart series by implementing the Series interface.
The gauges library is part of Charting for JavaScript. It supports oval and linear gauge with several types of labels and ticks. Various samples show you how the implement the gauges to create and customize all popular gauge types: car dashboard, clock, thermometer, compass etc. Learn more about Charting and Gauges for JavaScript at https://mindfusion.eu/javascript-chart.html.