MindFusion JavaScript Diagram Library V2.6

MindFusion JavaSript Diagram Library has a new version. Here is an overview of the new features:

Free-form nodes

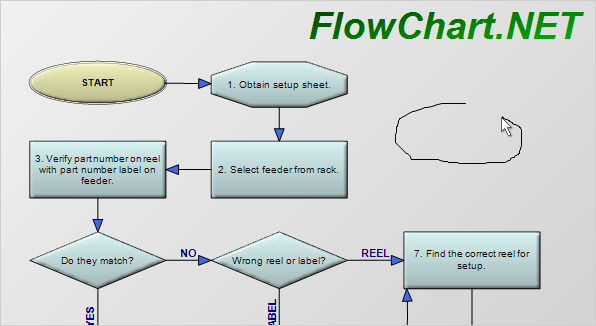
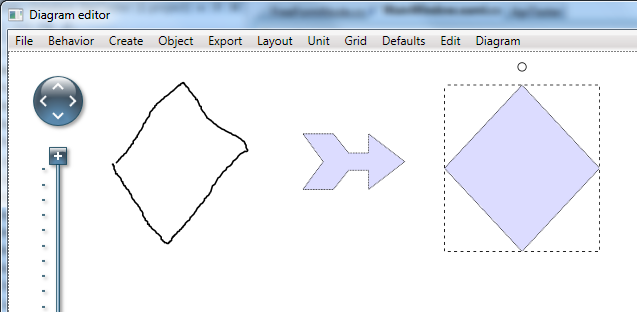
The new version lets you use a special, new type of nodes called FreeFormNode. In this case the control collects all points from users’ mouse or touch input and displays them as node’s outline. In order to allow users to draw free-form nodes interactively, set Behavior to DrawFreeForms or LinkFreeForms. The Points property of FreeFormNode allows you to get or set outline points programmatically. If the Closed property is set, the node is drawn as a closed shape and its interior filled, or otherwise the node is drawn as a poly-line.

Free form nodes allow the user to draw diagram shapes with the mouse of the finger

FreeFormNodes allow the user to draw diagram shapes with the mouse or the finger

Convert free-form drawings to ShapeNodes

This release introduces additional drawing modes, convenient for touch input. They convert FreeFormNode objects drawn by the user to ShapeNode objects with matching shapes. To enable them, set Behavior to DrawFreeShapes or LinkFreeShapes. The shapes against which the user’s input is matched are set via diagram’s FreeFormTargets property. By default it contains Rectangle, Decision and Ellipse shapes.

Miscellaneous

  • TypeScript definitions for the Diagramming API are now provided in jsdiag.d.ts file.
  • nodePasted and linkPasted events are now raised when new DiagramNode and DiagramLink instances are created from clipboard contents.
  • VirtualScroll mode fixed for parent div size specified in percent units.
  • Removed several global variables created inadvertently by the control.

A trial version is available for download here:

Download MindFusion Diagram Library for JavaScript, V2.6

About Diagramming for JavaScript Library: Written 100% in JavaScript, this tool is a dynamic, browser based visualization library that uses HTML5 Canvas to draw impressive diagrams, schemes, flowcharts, trees and many more. It is browser independent, easy to use and allows you to integrate interactive diagrams for JavaScript and HTML into any web application. This MindFusion graphing library supports a variety of predefined node shapes, customizable links, rich event set and many appearance options.

The user interaction model includes resizing / moving / selecting and modifying any diagram element. The library boasts an elegant API, which is documented in details, numerous step-by-step guides and tutorials. The Diagramming API also provides TypeScript definitions. Various samples are provided to let you learn quickly how to use the most important features of the library – check them here. The JavaScript diagram builder is not only the perfect choice for creating any type of diagram in the browser – it can also arrange it the way you wish with a mouse click using one of its automatic graph layout algorithms. For more details about the features of the component, please visit the Diagram for JavaScript page.

MindFusion.WinForms Pack, 2016.R2

MindFusion suite of WinForms controls has just been released and boasts a variety of new features to make you build WinForms applications faster and easier. Here is a review of the new version:

MindFusion Chart Control MindFusion.Charting

New data model

Data that should be drawn in charts is read through an interface called Series, whose instances can be assigned to the Series properties of Chart and SeriesRenderer classes. You can implement this interface in your own model classes to avoid duplicating data. The library includes several pre-defined series classes that let you specify data via IList or array objects.

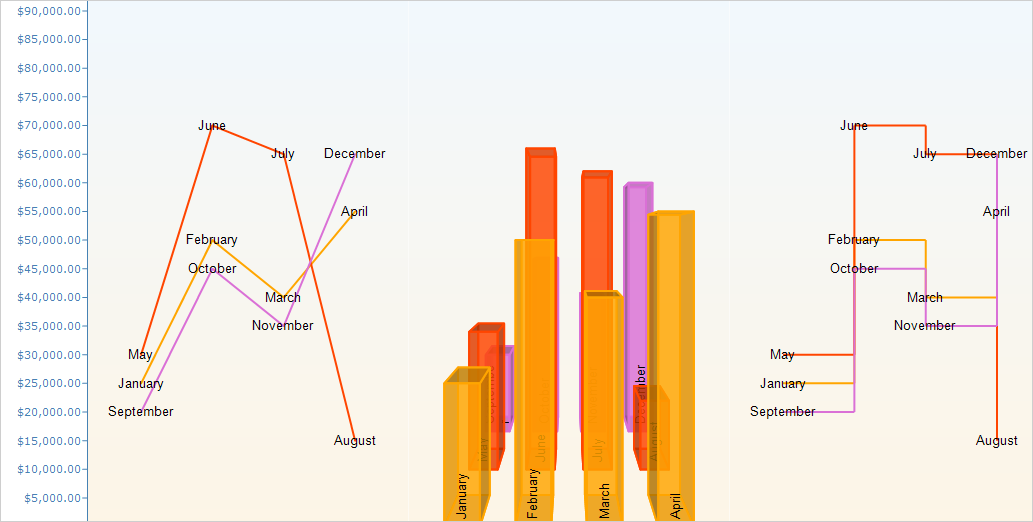
Different series types in a single plot

The new data model allows adding different series types to a single plot

New rendering model

Chart graphics are drawn inside Plot components by SeriesRenderer-derived objects. Each plot can contain multiple series renderers from same or different types. For example, you can draw area, line and bar graphics in same plot by adding AreaRenderer, LineRenderer and BarRenderer objects to its SeriesRenderers collection. Chart controls automatically generate a series renderer of appropriate type for their Series.

Dashboard

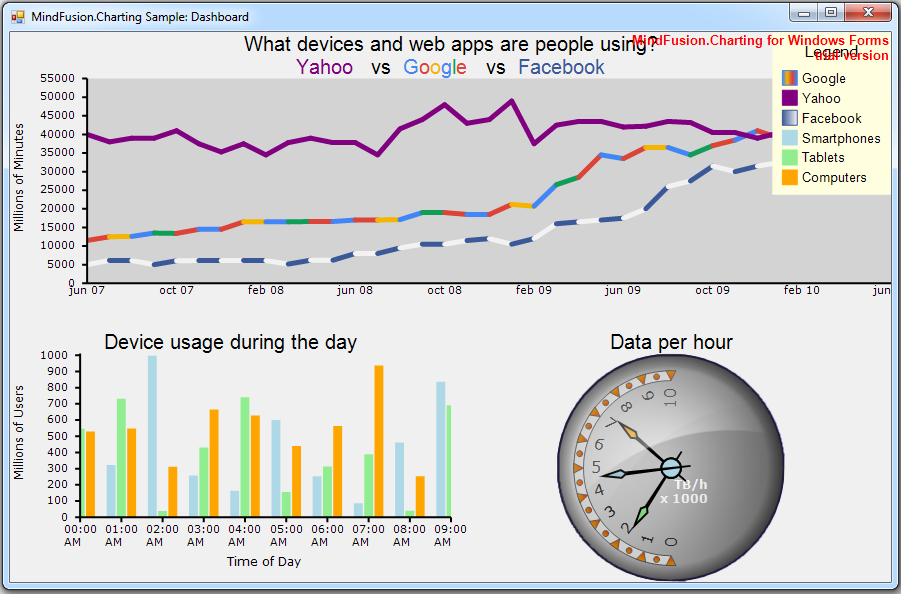
The Dashboard control can contain multiple plots, axes, legends, images, gauges and text blocks arranged in dynamic layout. Individual components can be added to dashboard’s default RootPanel or LayoutPanel containers, or for more complex layouts add intermediary panels such as GridPanel and StackPanel to the default ones. To show different types of chart graphics, add Plot2D to draw in 2D Cartesian coordinate system, Plot3D for 3D Cartesian system, and PolarPlot for polar coordinate system. To draw horizontal or vertical axes, add respectively XAxisRenderer and YAxisRenderer objects. To show gauges, add LinearGaugeRenderer or OvalGaugeRenderer, whose Gauge property contains the gauge model definition.

The new WinForms Chart has a built-in dashboard control.

The new WinForms Chart has a built-in dashboard control.

Print and export

The Dashboard control and Chart controls that derive from it expose Print and PrintPreview methods for printing on paper. Call the ExportImage and CreateImage methods to generate bitmap image of the dashboard. The ExportPdf method exports the chart to a PDF (Portable Document Format) file. The ExportSvg method exports the chart to an SVG (Scalable Vector Graphics) file.

Styling

Values of appearance properties can come from several places in the component hierarchy. SeriesRenderer-derived objects can use attributes from their local SeriesStyle, from plot’s SeriesStyle, or from the *Series properties in current Theme. Component classes use either their local properties or ones defined in the theme. By default, appearance properties in SeriesRenderer > and Component > classes have null values, which makes the drawing code use values from the theme.

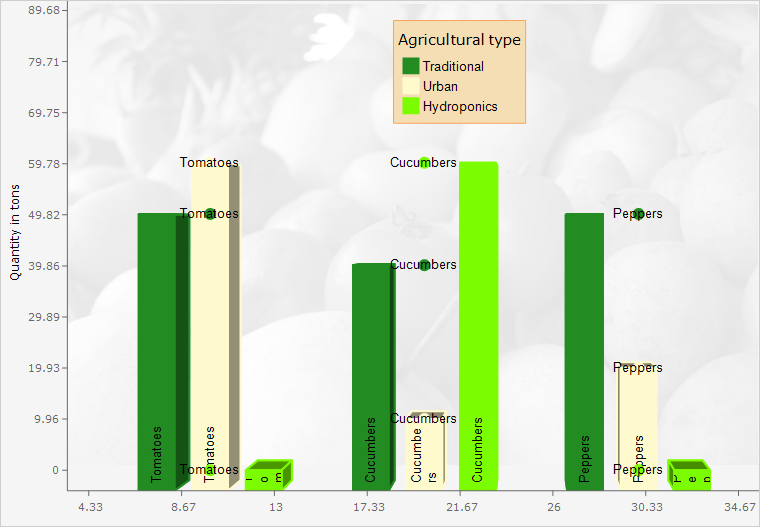
A rich choice of styling options are available

A rich choice of styling options are available

MindFusion WebForms Diagrammer MindFusion.Diagramming

Free-form nodes

A FreeFormNode collects all points from users’ mouse or touch input and displays them as node’s outline. To let users draw free-form nodes interactively, set Behavior to DrawFreeForms or LinkFreeForms. Use the Points property of FreeFormNode to get or set outline points programmatically. If the Closed property is set, the node is drawn as a closed shape and its interior filled, or otherwise the node is drawn as a poly-line. If the distance between first and last points drawn by user is shorter than AutoCloseDistance, the node’s Closed property is automatically set to true.

Free form nodes are drawn with the mouse

Free form nodes: just draw the node with the mouse and the control understands the shape you want

LinkLabel edit events

LinkTextEditing and LinkTextEdited events are now raised also when the user edits a LinkLabel. The Label property of the respective event-arguments class identifies the LinkLabel that is being edited. Label is a null reference if the user is editing link’s Text value.

keyboard16x16MindFusion Virtual Keyboard

MindFusion Virtual Keyboard has been initially added to MindFusion Pack for WinForms.

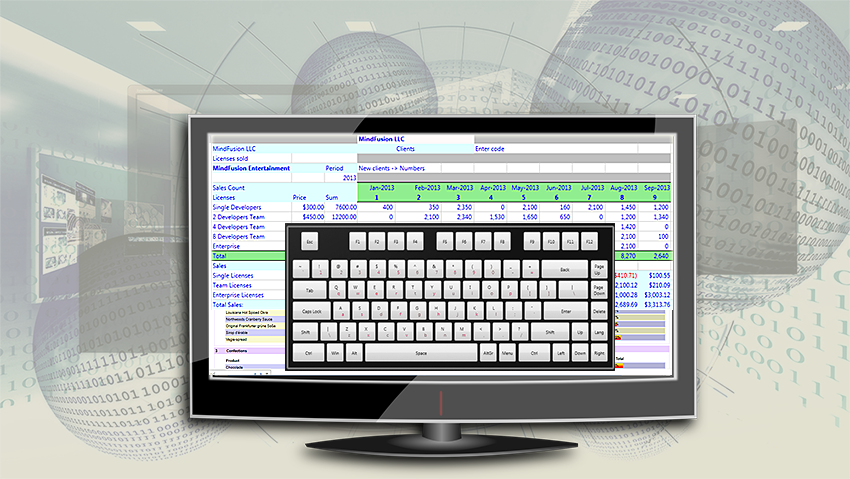
The WinForms virtual keyboard control: extended layout

The WinForms virtual keyboard control: extended layout

WPF Reporting ToolMindFusion.Reporting

Improved charts
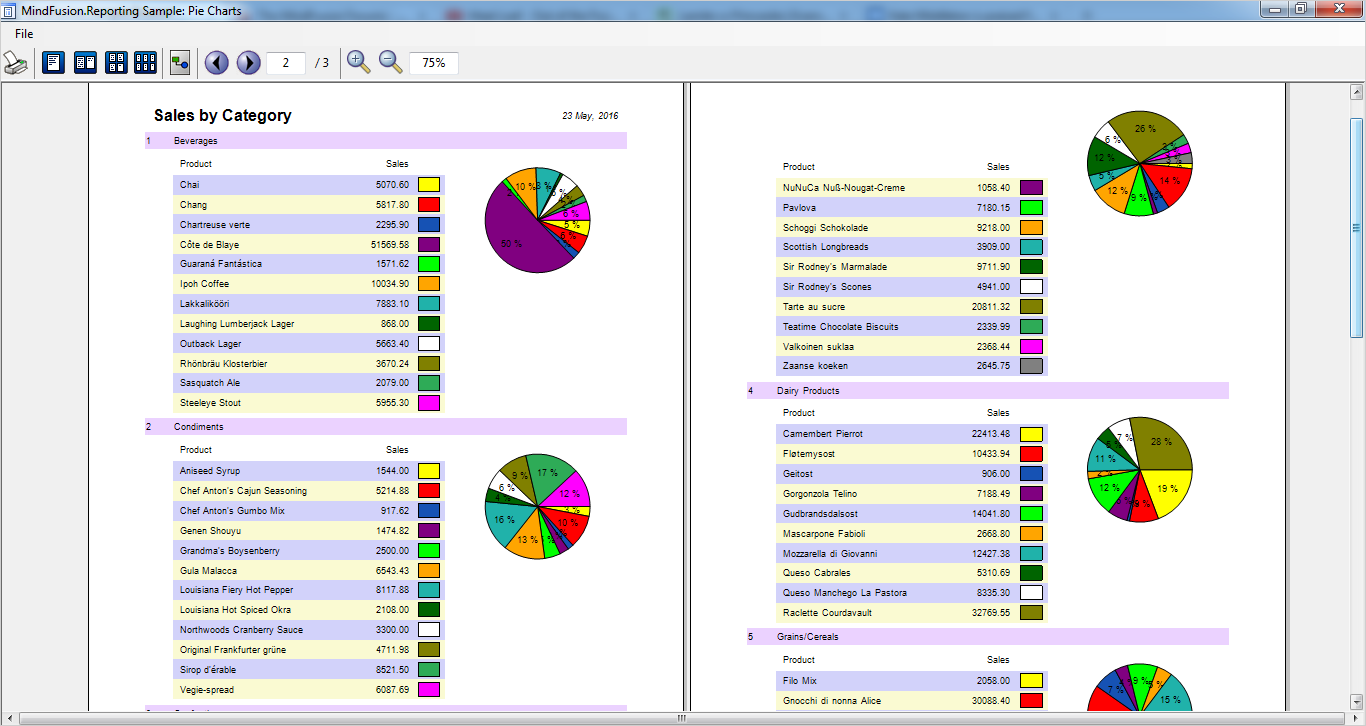
MindFusion.Reporting now uses the new MindFusion charting engine to display charts in reports. The presentation of the charts has been greatly improved (particularly when resizing the charts).

Pie charts in a WinForms report

Pie charts in a WinForms report

Spreadsheet-16x16MindFusion.Spreadsheet

New and improved charts
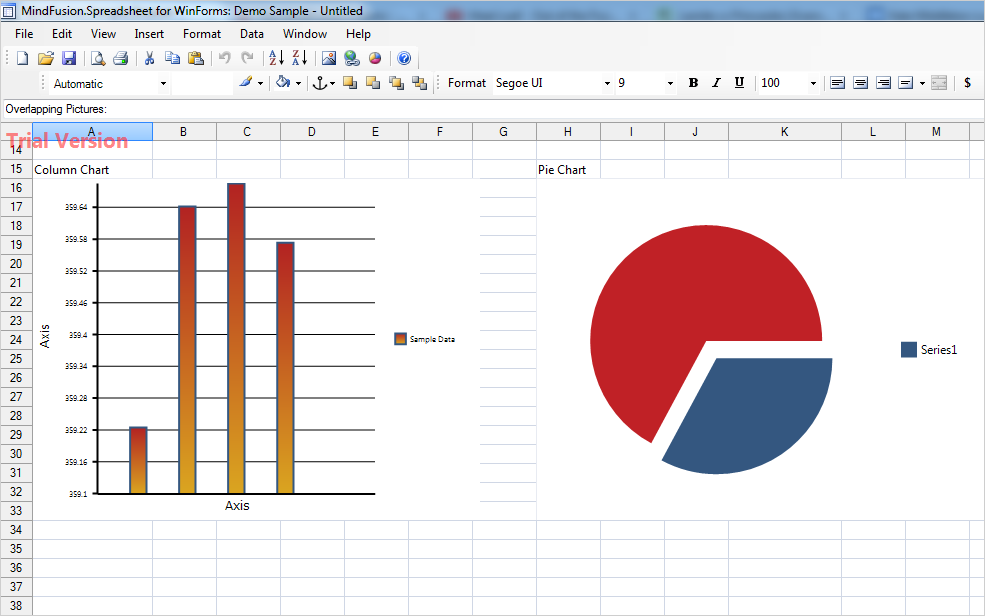
MindFusion.Spreadsheet now uses the new MindFusion charting engine to display charts in worksheets. Along with the improved appearance (particularly when resizing the charts), the following new features have been added:

  • New Candlestick chart type;
  • New BarOverlayed and ColumnOverlayed chart types;
  • Several new legend position types;

Zoom
The worksheets can now be zoomed in and out through the new Zoom property.

Charts in a spreadsheet

The new chart engine makes spreadsheets even more appealing

MindFusion clients can download the installer for the latest version from the clients area on MindFusion website.

A direct link to download the WinForms pack is available from here:

Download MindFusion WinForms Pack 2016.R2

Updated assemblies are also available as MindFusion.Pack NuGet package.

About MindFusion.WinForms Pack: A rich set of programming components that provide WinForms developers with the complete list of features to build even the most complicated business applications fast and easy. The components integrate seamlessly and provide with a mouse click functionality that takes months to develop. Each control boasts various samples and tutorials, extensive documentation and numerous customization options that make it suitable for every type of software and scenario.

Further details about each component in the pack are available from MindFusion website:

Use this link to buy a license online. All components are royalty-free.

Virtual Keyboard Controls Added To MindFusion WinForms/WPF Packs

MindFusion UI controls suite now includes a virtual keyboard.

MindFusion UI controls suite now includes a virtual keyboard.

Dear MindFusion current and future clients,
Dear FreezePro clients,

MindFusion is pleased to announce that as of April 2016 it has acquired FreezePro Virtual Keyboard components, which will be released as part of MindFusion WinForms/WPF controls suites. We want to use this opportunity to thank all MindFusion and FreezePro clients for the loyalty – you’ve chosen us over multiple competitive products and we believe you are satisfied with your choice.

To please you even more we offer you special prices for upgrading to MindFusion WinForms/WPF pack. You get a 30% discount on the difference between the price of a component’s license you own and the price of the WinForms/WPF pack license you want to buy. MindFusion clients who already own a WinForms/WPF Pack license get the Virtual Keyboard component free of charge.

If you want to use the preferential upgrade prices please send an e-mail to info@mindfusion.eu no later than May 31st, 2016.

If you have technical questions about any of the components please contact MindFusion at support@mindfusion.eu. Use the same email for questions about licensing or transfer of intellectual property rights.

Welcome to the bigger MindFusion family!

MindFusion WPF Pack

WPF Spreadsheet With Conditional Formatting and Sum Function

In this step-by-step guide we will create a spreadsheet in WPF, which represents a  template with the monthly bills.

I. Setup of the Project.

We create a new WPF project and add the following dlls:
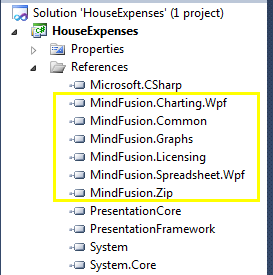
Spreadsheet for WPF: referenced dll-s.

Spreadsheet for WPF: referenced dll-s.

Then, in XAML, we map the spreadsheet namespace to the prefix “ss”:

xmlns:ss="http://mindfusion.eu/spreadsheet/wpf"

Finally, we create a WorkbookView and Workbook instances, which we’ll use later in code.

 <ss:WorkbookView x:Name="workbookView">
            <ss:Workbook x:Name="workbook" />
        </ss:WorkbookView>

II. Header.

The next step is to add a sheet to our workbook like this:

            var activeSheet = workbook.Worksheets.Add();
            workbookView.ActiveWorksheet = activeSheet;
            activeSheet.BeginInit();

Now, we can start to build the actual house bills template. First, we define the global formatting for the worksheet:

var globalStyle = activeSheet.CellRanges[0, 0, 
     activeSheet.Columns.Count - 1, activeSheet.Rows.Count - 1].Style;
            globalStyle.FontName = "Tahoma";
            globalStyle.FontSize = 10;

We get all cells from the active sheet and set the font name and font size, which we’ll be used when we edit them.

Then, we define the header of the bills template.

     //initialize header label and style
      var heading = activeSheet.CellRanges["A3:H3"];
      heading.Merge();
      activeSheet.Rows[2].Height = "40pt";
      activeSheet.Columns[0, 8].Width = "80pt";
      activeSheet.Cells["A3"].Data = "Bills for March, 2016";

The header is at the second row and spans from the first to the eighth cell e.g. from A3 to H3. We merge the cells and increase the height. We also increase the width of the first eight columns because we want larger cells to fit the bill content. Last but not least we set the label. The label is assigned to the first cell of the merged cells.

Next, we’ll do some styling of the font and label of the title:

     
      var headingStyle = heading.Style;            
      headingStyle.FontSize = 14;
      headingStyle.FontBold = true;            
      headingStyle.VerticalAlignment = MindFusion.Spreadsheet.Wpf.VerticalAlignment.Middle;
      headingStyle.PaddingLeft = "5pt";
      headingStyle.TextBrush = Brushes.LightSlateGray;

Here we get the Style object of the header, increase the font size and set the font style to bold, vertically align the title in the middle and add some padding to it. We use a slate gray brush for the heading. The underscore is done using two BorderBottom properties:

        headingStyle.BorderBottomBrush = Brushes.DarkGreen;
        headingStyle.BorderBottomSize = "2pt";

III. Description Block.

The description block is made of six cells:

string[] headerLabels = new string[] { "Description", "Start Date",
 "Due Date", "Amount", "Date Paid", "Remarks" };
            for (int i = 0; i < headerLabels.Length; i++)
                activeSheet.Cells[i, 4].Data = headerLabels[i];

Each cell describes certain data we’ll need for the house bills table. We want to apply some formatting to indicate this is a header row. We make the font bold and italic, align text in the middle, add a top border and gray background:

         heading = activeSheet.CellRanges["A5:H5"];
         headingStyle = heading.Style;
         headingStyle.HorizontalAlignment = 
MindFusion.Spreadsheet.Wpf.HorizontalAlignment.Center;
         headingStyle.Background = Brushes.LightGray;
         headingStyle.BorderTopBrush = Brushes.Gray;
         headingStyle.BorderTopSize = "1pt";
         headingStyle.FontItalic = true;
         headingStyle.FontBold = true;
         headingStyle.FontSize = 10;       

The description column will hold presumably more text and we merge three cells for it:

      //merge the cells with the description
      for (int i = 4; i < 15; i++)
        {
           var description = activeSheet.CellRanges[5, i, 7, i];
           description.Merge();
        }

Some of our cells show DateTime values. We want to format the data to show entries like “12-January-2016”. Here is how this is done:

       //format cells that hold date values
       activeSheet.CellRanges["B6:C15"].Style.Format = "dd-mmmm-yy";
       activeSheet.CellRanges["E6:E15"].Style.Format = "dd-mmmm-yy";

IV. Formulas.

We want to have a cell that sums all the current bills to give us an overview how much we have to pay this month. We’ll use the SUM function, which is just one of the many functions Spreadsheet for WPF supports – you can check the list here.

      activeSheet.Cells["D17"].Data = "=SUM(D6:D15)";
      activeSheet.Cells["D17"].Style.Format = "$##.##";

V. Conditional Formatting.

The last feature we want to add is to paint in red those bills whose sum is for more than 100 USD. That is done with conditional formatting:

      var billsStyle = activeSheet.CellRanges[3, 5, 3, 14].Style;
      billsStyle.Format = "$##.##";
      var format1 = billsStyle.ConditionalFormats.Add();
      format1.Type = 
         MindFusion.Spreadsheet.Wpf.ConditionalFormatType.CellValue;
      format1.Operator = 
         MindFusion.Spreadsheet.Wpf.ComparisonOperator.GreaterThan;
      format1.Second = "100";
      format1.Style.TextBrush = Brushes.Red;

We select the cells that render the sums and add a new IConditionalFormat object. It users the operator “greater than” and changes the text brush to red if the data of the cells gets higher than 100.

This is the final type of customization we’ve performed on this workbook. We call

activeSheet.EndInit();

to signalize that initialization for this worksheet is over. Here is the result:
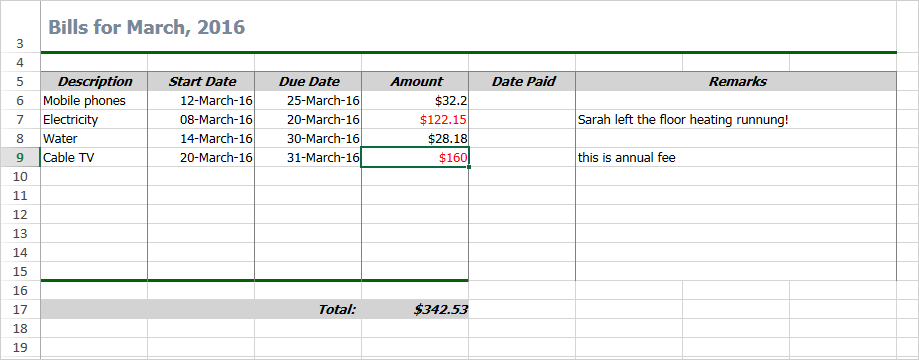
Spreadsheet for WPF Sample: Bills Template

Spreadsheet for WPF Sample: Bills Template

The sample is available for download from this link:

WPF Spreadsheet Control: House Expenses Template

The control’s libraries are included in the archive.

Technical support is available at the discussion board, per e-mail or at the help desk. We are happy to assist you.

About WPF Spreadsheet control from MindFusion: A native WPF component, which provides every single feature you’ll need to create an Excel-like spreadsheet in your own application in a matter of hours. The control is packed with a versatile chart library, which let’s you enhance your spreadsheets with compelling graphs of any type. The various user interaction options fit perfectly with the high demands of today’s application of performance and flexibility. Achieving the desired look and feel is easily accomplished with the efficient style system and the numerous appearance properties. The control provides a line of auxiliary forms, which enable programmers to easily edit and organize the spreadsheet data for the best and fastest possible results.

WPF Spreadsheet control is part of MindFusion WPF Pack of components – the tools that make WPF development fast and easy. Details here.
MindFusion Chart Control for WinForms, V4.0 Beta

MindFusion is proud to present you the beta version of Charting for WinForms, V4.0. MindFusion has entirely redesigned the control to create the most agile, lean and smart charting tool on the market. Below is a brief synopsis of the new chart for WinForms component.

New data model
Data that should be drawn in charts is read through an interface called Series, whose instances can be assigned to the Series properties of Chart and SeriesRenderer classes. You could implement this interface in your own model classes to avoid duplicating data. The library includes several pre-defined series classes that let you specify data via IList or array objects. For example, BarSeries lets you specify lists of values, inner labels and top labels, and PointSeries lets you specify data as a list of points.

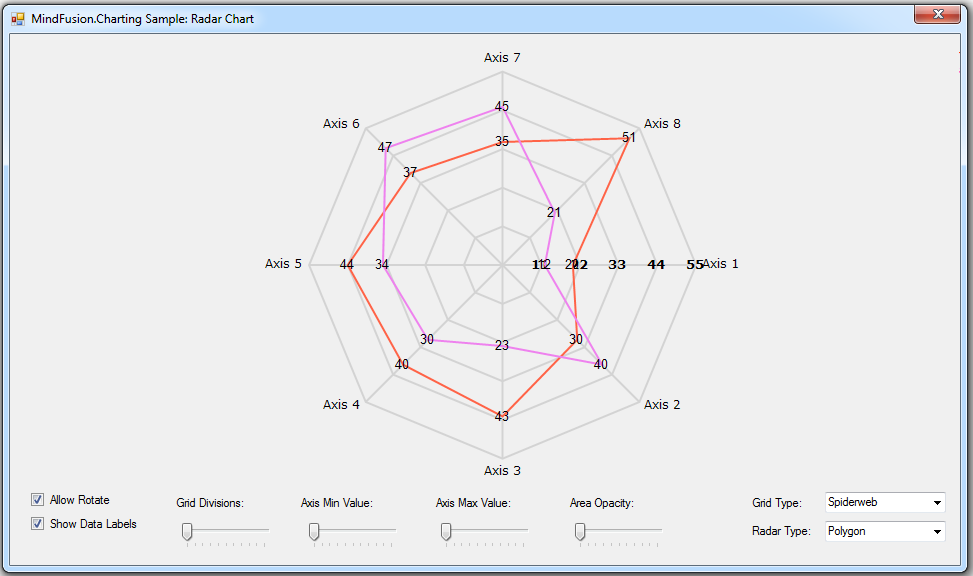
Radar chart with multiple series.

Radar chart with multiple series.

New rendering model
Chart graphics are drawn inside Plot components by SeriesRenderer -derived objects. Each plot can contain multiple series renderers from same or different types. For example, you can draw area, line and bar graphics in same plot by adding AreaRenderer, LineRenderer and BarRenderer objects to its SeriesRenderers collection. Concrete Chart classes automatically generate a series renderer of appropriate type for their Series.

Dashboard
The Dashboard control can contain multiple plots, axes, legends, images, gauges and text blocks arranged in dynamic layout. Individual components can be added to dashboard’s default RootPanel or LayoutPanel containers, or for more complex layouts add intermediary panels such as GridPanel and StackPanel to the default ones.

The new WinForms Chart  has a built-in dashboard control.

The new WinForms Chart has a built-in dashboard control.

Print and export
The Dashboard control and Chart controls that derive from it expose Print and PrintPreview methods for printing on paper. Call the ExportImage and CreateImage methods to generate bitmap image of the dashboard. The ExportPdf method exports the chart to a PDF (Portable Document Format) file. The ExportSvg method exports the chart to an SVG (Scalable Vector Graphics) file.

Styling
Values of appearance properties can come from several places in the component hierarchy. SeriesRenderer -derived objects can use attributes from their local SeriesStyle, from plot’s SeriesStyle, or from the *Series properties in current Theme. Component classes use either their local properties or ones defined in the theme. By default, appearance properties in SeriesRenderer and Component classes have null values, which makes the drawing code use values from the theme.

You can download the beta version directly from the link below. The archive file contains the control’s libraries, samples in C# and documentation.

Download Chart for WinForms, V4.0 Beta Version

Your feedback is valuable for us. Please use the forum or e-mail support@mindfusion.eu. to share your opinion, ask questions or submit a problem.

About Chart for WinForms: This is a smart WinForms dashboard control that lets you add the perfect chart or gauge to your application in a few easy steps. The control provides an elegant data model, which supports equally well arrays, xml, any .NET data source, lists or any other data model class, that you create by implementing the Series interface.

MindFusion WinForms Chart boasts an innovative rendering model, where each chart graphics is drawn by its own SeriesRenderer on a Plot. Each Plot supports unlimited number of chart or gauge series of any type. Plots, together with axes, legends, gauges, images, and text blocks can be combined in a Dashboard with the built-in dashboard control. Styling the chart is done on various levels – from appearance properties in each SeriesRenderer to more general settings in the Component classes. The control supports themes and comes with a set of stylish themes, which you can customize as you wish or create new ones from scratch.

Persisting the chart is possible in several ways – printing, export to PDF or to Svg images – all of them performed with a single method call.

The newly designed chart control is offered with unchanged prices and license scheme – check it here.