In this post we’ll show how to use the ASP.NET MVC diagram library and SignalR to implement collaborative drawing of diagrams. This can be useful in visual planning tools where users work together on a task, such as project management or mind-mapping applications.
The complete sample project is available here –
CollabMindMap.zip
Start by creating an ASP.NET MVC application in Visual Studio. Open Tools -> Library Package Manager -> Package Manager Console and install the MindFusion.Diagramming.Mvc package –
Install-Package MindFusion.Diagramming.Mvc
While we are there, also install the SignalR package –
install-package Microsoft.AspNet.SignalR
From the project’s context menu, Add submenu, select OWIN startup class and add SignalR to the OWIN pipeline by calling –
app.MapSignalR();
Now lets add a diagram view to the home page at Views/Home/Index.cshtml, load the necessary script files and wire up diagram event handlers that will send change notifications to the hub –
@using MindFusion.Diagramming
@using MindFusion.Diagramming.Mvc

@{
    var diagView = new DiagramView("diagramView")
        .NodeCreatedScript("onNodeCreated")
        .NodeModifiedScript("onNodeModified")
        .NodeTextEditedScript("onNodeTextEdited")
        .LinkCreatedScript("onLinkCreated")
        .LinkModifiedScript("onLinkModified")
        .LinkTextEditedScript("onLinkTextEdited")
        .ControlLoadedScript("onDiagramLoaded")
        .SetAllowInplaceEdit(true);

    diagView.Diagram.DefaultShape = Shapes.Ellipse;
}

@Html.DiagramView(diagView, new { style = "width:700px; height:600px;" })

@section scripts
{
    @Scripts.Render("~/Scripts/jquery.signalR-2.0.0.js")
    @Scripts.Render("~/Scripts/MindMap.js")
    @Scripts.Render("~/signalr/hubs")
}
The hub will synchronize operations done on the diagram by one client by sending a notification to all other connected clients. From the project context menu add a SignalR hub class, naming it DiagramHub. The model class we’ll use to describe node changes looks like this –
public class NodeModel
{
    [JsonProperty("x")]
    public double X { get; set; }

    [JsonProperty("y")]
    public double Y { get; set; }

    [JsonProperty("width")]
    public double Width { get; set; }

    [JsonProperty("height")]
    public double Height { get; set; }

    [JsonProperty("id")]
    public string Id { get; set; }

    [JsonProperty("text")]
    public string Text { get; set; }
}
Add these three methods to the hub class to synchronize node creation, move, resize and edit-text operations –
public void NodeCreated(NodeModel clientModel)
{
    Clients.AllExcept(Context.ConnectionId).nodeCreated(clientModel);
}
public void NodeModified(NodeModel clientModel)
{
    Clients.AllExcept(Context.ConnectionId).nodeModified(clientModel);
}
public void NodeTextEdited(NodeModel clientModel)
{
    Clients.AllExcept(Context.ConnectionId).nodeTextEdited(clientModel);
}
The diagram event handlers in MindMap.js fill in the model objects and call respective hub methods –
function onNodeCreated(s, e)
{
    var hubId = $.connection.hub.id;
    e.node.id = hubId + s.getItems().length;

    var r = e.node.bounds;
    var model =
    {
        id: e.node.id,
        x: r.x,
        y: r.y,
        width: r.width,
        height: r.height
    };

    diagramHub.server.nodeCreated(model);
}

function onNodeModified(s, e)
{
    var r = e.node.bounds;
    var model =
    {
        id: e.node.id,
        x: r.x,
        y: r.y,
        width: r.width,
        height: r.height
    };
    diagramHub.server.nodeModified(model);
}

function onNodeTextEdited(s, e)
{
    var model =
    {
        id: e.node.id,
        text: e.getNewText()
    };
    diagramHub.server.nodeTextEdited(model);
}
Handle notifications sent from server to clients by updating the diagram from received model objects –
$(function ()
{
    diagramHub = $.connection.diagramHub;
    diagramHub.client.nodeCreated = function (model)
    {
        var node = diagram.factory.createShapeNode(
            model.x, model.y, model.width, model.height);
        node.id = model.id;
    };
    diagramHub.client.nodeModified = function (model)
    {
        var node = findNode(model.id);
        node.setBounds(
            new MindFusion.Drawing.Rect(
                model.x, model.y, model.width, model.height),
            true);
    };
    diagramHub.client.nodeTextEdited = function (model)
    {
        var node = findNode(model.id);
        node.setText(model.text);
    };
    $.connection.hub.start();
});
Finally add these helper functions for finding items and storing a global diagram reference –
function onDiagramLoaded(s, e)
{
    diagram = s;
}

function findNode(id)
{
    for (var i = 0; i < diagram.nodes.length; i++)
    {
        var node = diagram.nodes[i];
        if (id == node.id)
            return node;
    }
    return null;
}

function findLink(id)
{
    for (var i = 0; i < diagram.links.length; i++)
    {
        var link = diagram.links[i];
        if (id == link.id)
            return link;
    }
    return null;
}
Start several copies of the application in separate browser instances on your system (or even on different machines if you publish it on IIS or Azure). Now start drawing nodes, moving them or editing their text – changes done on the diagram in one browser will be immediately reflected in all other browsers connected to the hub. However we aren’t yet synchronizing link operations; lets fix that –
public class LinkModel
{
    [JsonProperty("id")]
    public string Id { get; set; }

    [JsonProperty("originId")]
    public string OriginId { get; set; }

    [JsonProperty("destinationId")]
    public string DestinationId { get; set; }

    [JsonProperty("text")]
    public string Text { get; set; }
}
Add following hub methods in server class –
public void LinkCreated(LinkModel clientModel)
{
    Clients.AllExcept(Context.ConnectionId).linkCreated(clientModel);
}
public void LinkModified(LinkModel clientModel)
{
    Clients.AllExcept(Context.ConnectionId).linkModified(clientModel);
}
public void LinkTextEdited(LinkModel clientModel)
{
    Clients.AllExcept(Context.ConnectionId).linkTextEdited(clientModel);
}
Call them from respective JavaScript handlers of diagram link events –
function onLinkCreated(s, e)
{
    var hubId = $.connection.hub.id;
    e.link.id = hubId + s.getItems().length;

    var model =
    {
        id: e.link.id,
        originId: e.link.getOrigin().id,
        destinationId: e.link.getDestination().id,
    };

    diagramHub.server.linkCreated(model);
}

function onLinkModified(s, e)
{
    var hubId = $.connection.hub.id;
    var model =
    {
        id: e.link.id,
        originId: e.link.getOrigin().id,
        destinationId: e.link.getDestination().id,
    };
    diagramHub.server.linkModified(model);
}

function onLinkTextEdited(s, e)
{
    var model =
    {
        id: e.link.id,
        text: e.getNewText()
    };
    diagramHub.server.linkTextEdited(model);
}
Handle link-related client notifications by creating or modifying links –
diagramHub.client.linkCreated = function (model)
{
    var link = diagram.factory.createDiagramLink(
        findNode(model.originId), findNode(model.destinationId));
    link.id = model.id;
};
diagramHub.client.linkModified = function (model)
{
    var link = findLink(model.id);
    link.setOrigin(findNode(model.originId));
    link.setDestination(findNode(model.destinationId));
};
diagramHub.client.linkTextEdited = function (model)
{
    var link = findLink(model.id);
    link.setText(model.text);
};
Now the application will also synchronize link operations across all connected clients. Here’s a small diagram synchronized between three different browsers –
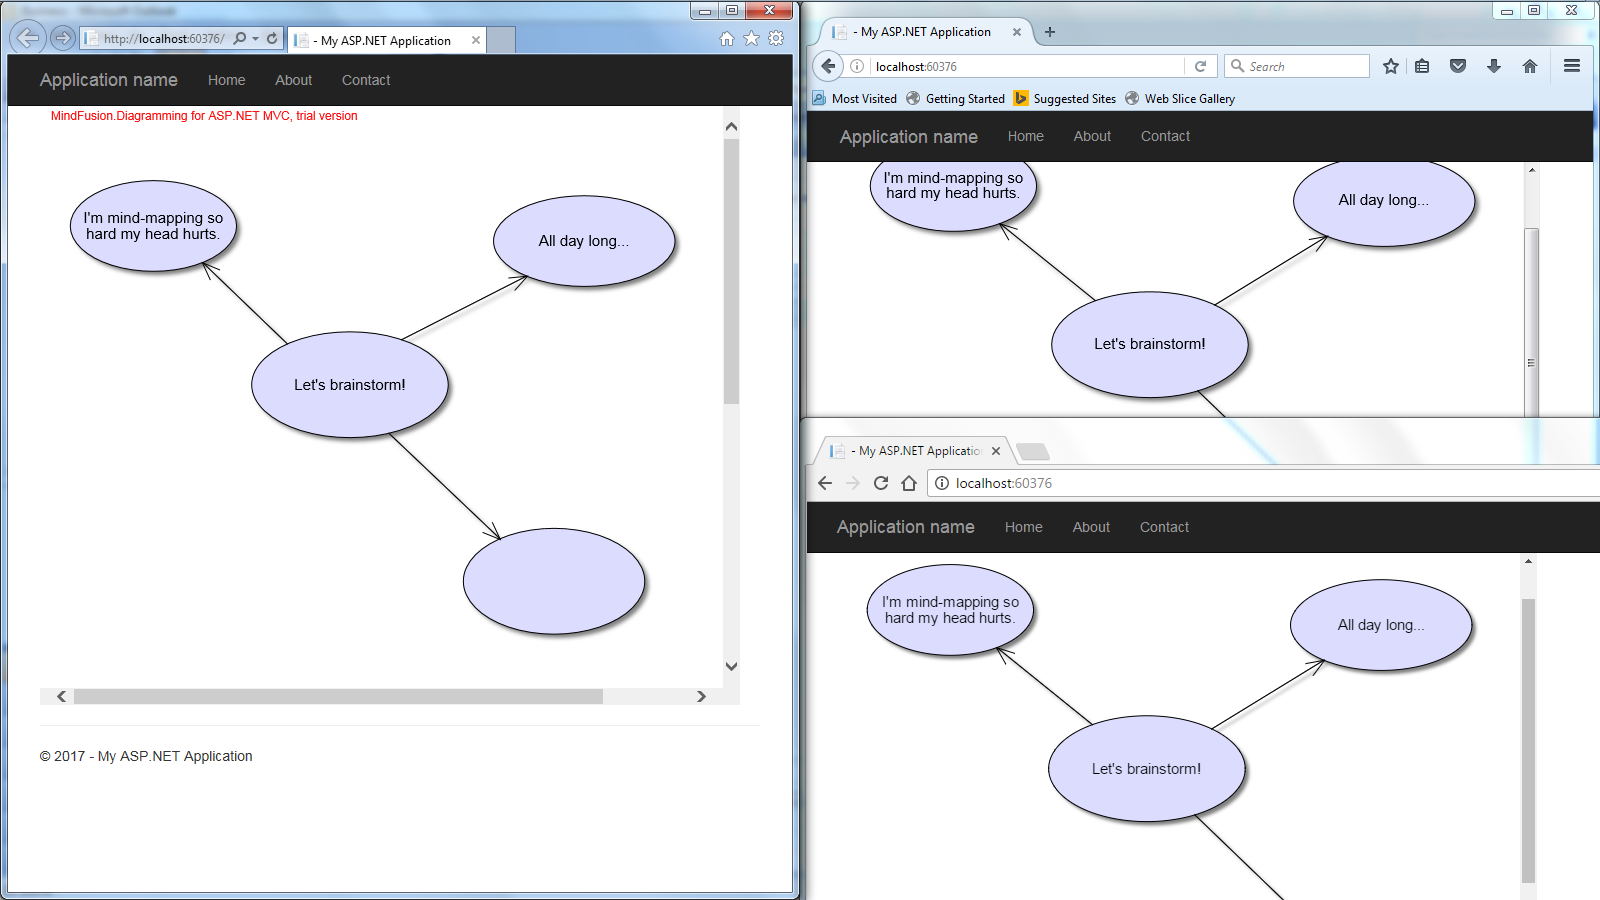
The sample above uses MindFusion’s ASP.NET MVC API. Code for other frameworks will look similar as MindFusion maintains same diagramming model for multiple platforms. You can download the trial version of any MindFusion.Diagramming component from this page.
Enjoy!