Line Chart with DateTime Data in ASP.NET

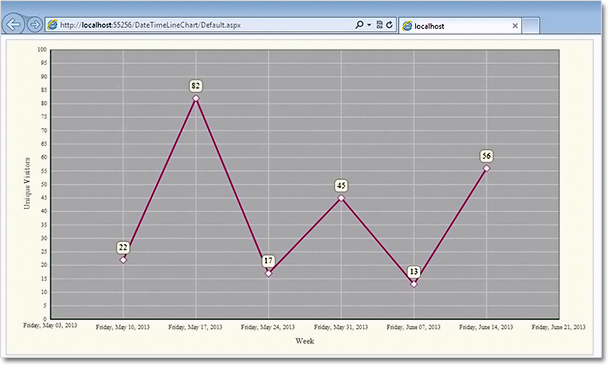
In this post we demonstrate how to use MindFusion.Charting for ASP.NET component to create a line chart that shows the number of unique visitors to a store/website in a period of 6 weeks.

Data

The data for the X-axis are DateTime values. We create an array with the DateTime values that we’ll use and add it to the XData property of our chart. Before that we have to delete the predefined array that is added when the control is dropped at the form:

DateTime dt1 = new DateTime(2013, 6, 14);
DateTime dt2 = new DateTime(2013, 6, 7);
DateTime dt3 = new DateTime(2013, 5, 31);
DateTime dt4 = new DateTime(2013, 5, 24);
DateTime dt5 = new DateTime(2013, 5, 17);
DateTime dt6 = new DateTime(2013, 5, 10);

ArrayList data = new ArrayList() { dt1, dt2, dt3, dt4, dt5, dt6 };
LineChart1.XData.Clear();
LineChart1.XData.Add(data);

Next, we must make some adjustments in the settings for the X-axis to tell the control that DateTime data is used. We set the DataFormat property to DateTime and we specify the time range for the axis. This is how we do this:

LineChart1.XAxisSettings.DataFormat = MindFusion.Charting.DataFormat.DateTime;

LineChart1.XAxisSettings.StartDateTime = new DateTime(2013, 5, 3);
LineChart1.XAxisSettings.EndDateTime = new DateTime(2013, 6, 20);
//set the interval to one week - 7 days
LineChart1.XAxisSettings.TimeSpan = new TimeSpan(7, 0, 0, 0);

The data for the Y-axis are numbers. We can set them through the property grid or set them in code.

LineChart1.YData.Clear();
ArrayList data1 = new ArrayList() { 56, 13, 45, 17, 82, 22 };
LineChart1.YData.Add(data1);

The X-axis

First, we must change the LabelType property of XAxisSettings from “ChartData”, which is the default to “AutoScale”. This will make the axis show the time range we’ve set in code above. Then, we change how the DateTime values will be formatted. The Default DateTimeFormat shows the full time and date and is not suitable. We change it to “LongDate”, which does not draw any time.

XAxisSettings-DateTimeFormat="LongDate" 
XAxisSettings-DrawTicksUniformly="False" XAxisSettings-DrawZero="True" 
XAxisSettings-LabelBrush="s:#FF696969" XAxisSettings-LabelOffset="10" 
XAxisSettings-LabelType="AutoScale" XAxisSettings-TitleLabel="Week" 
XAxisSettings-TitleLabelBrush="s:#FF696969" XAxisSettings-TitleLabelOffset="10"

We type “Week” as TitleLabel for the axis and set the DrawZero property to true to show the first label, which is otherwise omitted.

Upon preview we notice that the labels are too close to the axis, that’s why we use LabelOffset and TitleLabelOffset to add some space before them. Finally, we change the color of the labels, to make them dark gray rather than black.

The Y-axis

Customizing the Y-axis is rather simple. We change the interval with AxisDelta to 5 and increase the MaxValue to 100. We don’t need decimal fractions for the labels, that’s why we change the NumberFormat. We add a TitleLabel and change its orientation with TitleLabelOrientation. Finally we use LabelBrush and TitleLabelBrush to change the colors of the labels – we use the same brushes as for the X-axis.

YAxisSettings-AxisDelta="5" 
YAxisSettings-LabelBrush="s:#FF696969" 
YAxisSettings-MaxValue="100" YAxisSettings-NumberFormat="Fixed_point_0Digits" 
YAxisSettings-TitleLabel="Unique Visitors" 
YAxisSettings-TitleLabelBrush="s:#FF696969" 
YAxisSettings-TitleLabelOrientation="BottomToTop"

The Grid

Initially the chart shows no grid – but we want to show a grid. That’s why we change GridType to “Crossed” and set a GridPen. The dark gray background of the plot area together with its outlining are set with PlotAreaOutlinePen and PlotAreaBrush.

GridPen="n:0/#FFE1E1E1/0/0/0//0/0/10/" GridType="Crossed" PlotAreaBrush="s:#FFC0C0C0" 
PlotAreaOutlinePen="n:0/#FF787878/0/0/0//0/0/10/"

This is the code that was generated by the designer because we set the properties through the property grid. If we set them with code, it will be:

LineChart1.GridPen = new MindFusion.Drawing.Pen(Color.FromArgb(225,225,225));
LineChart1.GridType = MindFusion.Charting.GridType.Crossed;
LineChart1.PlotAreaBrush = new MindFusion.Drawing.SolidBrush(Color.FromArgb(192, 192, 192));
LineChart1.PlotAreaOutlinePen = new MindFusion.Drawing.Pen(Color.FromArgb(120, 120, 120));


The Line Series

We want scatters at data points and we want to show labels above those scatters. The LabelType property lets us set the type to be both line and scatters:

LineChart1.LineType = MindFusion.Charting.LineTypes.Line | MindFusion.Charting.LineTypes.Scatter;

This is the default type, so you don’t need to set it if you have not changed it before. We use ShapeBrushes, ShapePens and ShapeSizes to set the brushes and size of the scatters. We can do this in the property grid or in code. Finally, we want to show labels above scatters. We use LabelType and LabelFormat to set what kind of labels are drawn and since our labels are numbers – how they are formatted.

LabelBorder="RoundedRect" LabelBorderBackground="s:#FFFFFFE0" LabelBorderOutline="n:0/#FF787878/0/0/0//0/0/10/" LabelFormat="Fixed_point_0Digits" LabelType="Data"

In code you write:

LineChart1.LabelBorder = MindFusion.Charting.Border.RoundedRect;
LineChart1.LabelBorderBackground = new MindFusion.Drawing.SolidBrush(Color.FromArgb(255, 255, 224));
LineChart1.LabelBorderOutline = new MindFusion.Drawing.Pen(Color.FromArgb(120, 120,120));
LineChart1.LabelFormat = MindFusion.Charting.NumberFormat.Fixed_point_0Digits;
LineChart1.LabelType = MindFusion.Charting.LabelType.Data;

Here is the final chart:

Line chart with DateTime values in ASP.NET

Line chart with DateTime values in ASP.NET

You can download the sample from this link:

Download Line Chart for ASP.NET Sample

The trial version of the component is available from here:

MindFusion.Charting for ASP.NET Trial Version Download

Working Hours Bar Chart in WinForms

In this post we will explore how to create a bar chart that shows the weekly working hours for each
member of a team. We use MindFusion.Charting for WinForms component.

The Type of the Bar Chart

We decide to use a horizontal bar chart, which will give a clear visual representation of the data in this case. We use the BarType property to choose the bar type and set the Horizontal property:

barChart1.Horizontal = true;
barChart1.BarType = MindFusion.Charting.BarType.Single3D;

A 3D chart would look more sophisticated so we choose “Single3D” for a BarType.

The Data

We don’t need to set data for both axes – one is enough. The control automatically sets values for the
other axis to make the bars equally distributed. We can write the data by hand or use the built-in
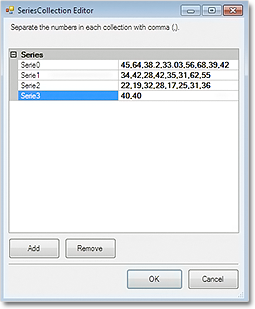
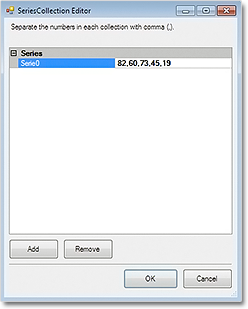
design time collection editor:


barChart1.Data.Add(new List() { 82, 60, 73, 45, 19, 34, 58, 23, 69, 17 });

The data collection editor

The data collection editor

The Axes

The X-axis shows a scale of the total working hours for the week. We set its LabelType to “AutoScale
and set the interval to 10:

barChart1.XAxisSettings.LabelType = MindFusion.Charting.AxisLabelType.AutoScale;
barChart1.XAxisSettings.AxisDelta = 10;

This is the only axis that shows numbers on the chart, so we show the starting zero number:

barChart1.XAxisSettings.DrawZero = true;

We want to show whole numbers at the axis – no decimal fractions – and we use the NumberFormat property to set this:

barChart1.XAxisSettings.NumberFormat = MindFusion.Charting.NumberFormat.Fixed_point_0Digits;

Finally, we set the title:

barChart1.XAxisSettings.TitleLabel = "Total Weekly Hours";

For the Y-axis we want to show custom labels – the name of each employee. We use the YLabels property to specify the labels and set YAxisSettings.LabelType to the appropriate value:

barChart1.YAxisSettings.LabelType = MindFusion.Charting.AxisLabelType.CustomText;
barChart1.YLabels.Add(new List() { "Mary Johnson", "Tim Davidson", "Alan Hank", "Elisa Labate", "Boris Foster", "Tim Carnes", "Olivia Beverling", "Mark Buchanan", "Ron Callary", "Cindy Peterson" });

The Grid

A vertical grid will help us identify the value of each bar. The GridType property, together with the
GridBrush and AltGridBrush help use set the type and colors of the grid. We outline the plot area with PlotAreaOutline:

GridType = MindFusion.Charting.GridType.VertScale;
barChart1.GridBrush = new MindFusion.Drawing.SolidBrush(Color.White);
barChart1.AltGridBrush = new MindFusion.Drawing.SolidBrush(Color.FromArgb(240, 240, 240));
PlotAreaOutlinePen = new MindFusion.Drawing.Pen(Color.FromArgb(220, 220, 220));

The Bar Colors

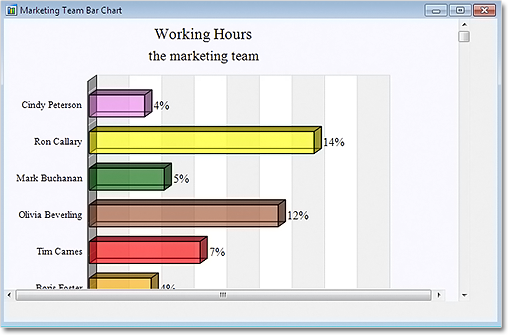
We use ChartBrushes and ChartPens to specify how our bars will be colored. Here is the final chart:

3D BarChart in .NET WinForms

3D BarChart in .NET WinForms

Scrolling the chart:

We set the ResizeType to “Scrollable“. This way we can scroll to see all data on the chart without the need to increase the size of the chart and let it take too much space.

barChart1.ResizeType = MindFusion.Charting.WinForms.ResizeType.Scrollable;

The sample is available for download from here:

Download WinForms Working Hours Bar Chart Sample

A trial version of MindFusion.Charting for WinForms is available from here:

Download MindFusion.Charting for WinForms

Implementing drag & drop in MindFusion.Scheduling for WPF

In this post we will discuss how to implement drag & drop using MindFusion.Scheduling for WPF. The goal is to enable users to create appointments by dragging items from an external source and dropping them onto the Calendar control surface.

The source

For the purposes of this sample the drag & drop source would be a simple ListBox control. The following XAML declares a ListBox with several predefined items:

  Task #1
  Task #2
  Task #3
  Task #4
  Task #5
  Task #6

The calendar

To enable the Calendar control to be the target of drag & drop operations, set its AllowDrop property to true. The following XAML snippet illustrates the definition of the Calendar control:

<planner:calendar x:name="calendar" grid.column="1" currentview="ResourceView" grouptype="GroupByResources" theme="Silver" allowdrop="True">
  <planner:calendar.itemresources>
    <planner:resource name="Resource #1">
    <planner:resource name="Resource #2">
    <planner:resource name="Resource #3">
  </planner:resource></planner:resource></planner:resource></planner:calendar.itemresources>
</planner:calendar>

The calendar is set up to display three resources in a Resource view.

The drag & drop

The drag & drop operation is initiated by calling the DragDrop.DoDragDrop static method and passing a reference to the dragged data. In our case we would want to initiate drag & drop when the user clicks on an item in the ListBox and starts dragging. Because the MouseDown event is consumed by the ListBox when the mouse is pressed over an item, we need to handle the PreviewMouseDown event. The following C# code displays the handlers of the PreviewMouseDown and MouseMove events:

private void taskList_PreviewMouseDown(object sender, MouseButtonEventArgs e)
{
  mouseDown = e.LeftButton == MouseButtonState.Pressed;
}

private void taskList_MouseMove(object sender, MouseEventArgs e)
{
  if (taskList.SelectedItem != null && mouseDown)
  {
    mouseDown = false;
    string data = ((ListBoxItem)taskList.SelectedItem).Content.ToString();
    DragDrop.DoDragDrop(taskList, data, DragDropEffects.Copy);
  }
}

To give visual feedback to the user when the mouse moves over the Calendar control during drag & drop operation, handle the DragOver event:

private void calendar_DragOver(object sender, DragEventArgs e)
{
  e.Effects = DragDropEffects.None;
  if (e.Data.GetDataPresent(typeof(string)))
  {
    DateTime? date = calendar.GetDateAt(e.GetPosition(calendar));
    if (date != null)
      e.Effects = DragDropEffects.Copy;
  }
}

This handler checks whether the dragged data matches the expected type and whether the location under the mouse cursor represents a valid date.

Finally, handle the Calendar.Drop event. This event is raised when the user releases the mouse over the Calendar control during a drag & drop operation.

private void calendar_Drop(object sender, DragEventArgs e)
{
  if (e.Data.GetDataPresent(typeof(string)))
  {
    Point point = e.GetPosition(calendar);
    DateTime? date = calendar.GetDateAt(point);
    Resource resource = calendar.GetResourceAt(point);
    if (date != null && resource != null)
    {
      string task = (string)e.Data.GetData(typeof(string));
      Appointment appointment = new Appointment();
      appointment.HeaderText = task;
      appointment.StartTime = date.Value;
      appointment.EndTime = appointment.StartTime.AddDays(2);
      appointment.Resources.Add(resource);
      calendar.Schedule.Items.Add(appointment);
    }
  }
}

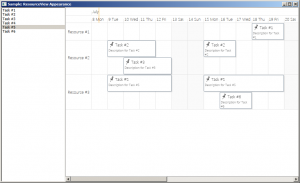
The following image shows the running sample with several created appointments:

Drag & drop

The source code is available for download from here:

Download the Complete Source Code for the Sample

You can get the trial version of MindFusion.Scheduling for WPF from this link:

Download MindFusion.Scheduling for WPF Trial Version

Line Chart in Silverlight with Two Legends, Scatters and Custom Labels

In this post we are discussing how to build a line chart with multiple series, scatters in custom colors,
two legends and custom labels at the X-axis. We are building the chart in Silverlight, using the
MindFusion.Charting for Silverlight tool.

Data

The data for the chart is taken from an ObservableCollection, where each member represents sales for a
given month.

lineChart1.DataSource = sales;

The Axes

The Y-axis shows an auto scale. This is the default LabelType so we don’t need to change it. But we want custom title label and intervals of 100. Here is how we set this:

lineChart1.YAxisSettings.Interval = 100L;
lineChart1.YAxisSettings.TitleOffset = 10.0;
lineChart1.YAxisSettings.Title = "USD";

The X-axis requires more customization. We want to show custom labels, that’s why we must set them and change the LabelType to show them:

lineChart1.XAxisSettings.LabelType = LabelType.CustomText;
lineChart1.XAxisSettings.CustomLabelPosition = CustomLabelPosition.ChartDataPoints;

We use the XLabelPath property to bind the Month field in our DataSource to the X-labels of the chart. We also set the maximum value at the X-axis and draw pointers to the labels by setting the Tick property.


lineChart1.XAxisSettings.MaxValue = sales.Count + 1;
lineChart1.XAxisSettings.Tick = 5.0;

The Series

The data for each series comes from a specific field in the DataSource collection:

lSeries1.YDataPath = "Turnover";
lSeries2.YDataPath = "Profit";

We want to show scatters and we use the ScatterType property to set the type. By default the type is “None” and no scatters are drawn. We need to change that:

lSeries1.ScatterType = ScatterType.Diamond;
lSeries1.ScatterSize = 20;

The brushes for the scatters are set with a BrushCollection:

BrushCollection sBrushes1 = new BrushCollection();
sBrushes1.Add(new SolidColorBrush(Colors.Red));
sBrushes1.Add(new SolidColorBrush(Colors.Yellow));
sBrushes1.Add(new SolidColorBrush(Colors.Green));


lSeries1.ScatterFills = sBrushes1;

Finally, don’t forget to add your LineSeries to the chart:

lineChart1.Series.Add(lSeries1);
lineChart1.Series.Add(lSeries2);

Legends

In this chart we need two legends – one is for the scatters and one for the series. They are both of
type SeriesLegend, which gives us control over the brushes and labels used.

The legend for the scatters is docked to the bottom and is aligned in the center.

MindFusion.Charting.Silverlight.SeriesLegend legend =
new MindFusion.Charting.Silverlight.SeriesLegend();
legend.LabelsSource = new List() { "Higher than expected", "Lower than expected", "Meets expectations"};
legend.BorderBrush = new SolidColorBrush(Colors.LightGray);
LayoutPanel.SetDock(legend, Dock.Bottom);
legend.HorizontalAlignment = System.Windows.HorizontalAlignment.Center;

Here is how we set the brushes:

BrushCollection brushes = new BrushCollection();
brushes.Add(new SolidColorBrush(Colors.Green));
brushes.Add(new SolidColorBrush(Colors.Red));
brushes.Add(new SolidColorBrush(Colors.Yellow));
legend.BrushesSource = brushes;
lineChart1.Legends.Add(legend);

The code for the other legend is similar, but we dock it to the right and align it to the top:

LayoutPanel.SetDock(sLegend, Dock.Right);
sLegend.VerticalAlignment = System.Windows.VerticalAlignment.Top;

Finally, don’t forget to add the two legends to the chart:

lineChart1.Legends.Add(legend);
lineChart1.Legends.Add(sLegend);

Here is the final result:

Line chart with scatters, two legends and custom labels. The platform is Silverlight.

Line chart with scatters, two legends and custom labels. The platform is Silverlight.

The source code is available for download from here:

Download the Complete Source Code for the Sample

You can get the trial version of MindFusion.Charting for Silverlight from this link:

Download MindFusion.Charting for Silverlight Trial Version

Create a block diagram editor in JavaScript

In this example, we will create a block diagram editor using MindFusion.Diagramming for JavaScript.

First, let’s add two HTML canvas elements to a page, one for the Diagram control and one for a NodeListView control that will serve as a tool palette:

<!-- The Diagram component is bound to the canvas element below -->

<div style="width:800px; height:600px; overflow:auto; border: 1px solid;">
  <canvas id="diagram" width="2100" height="2100">
    This page requires a browser that supports HTML 5 Canvas element.
  </canvas>
</div>


<!-- NodeListView control -->

<div style="width:130px; height:600px; overflow:none; border: 1px solid rgb(0, 0, 0);">
  <canvas id="nodeList" width="130" height="600"></canvas>
</div>

Next, add references to the necessary script files:

<script src="MicrosoftAjax.js" type="text/javascript"></script>
<script src="MindFusion.Diagramming.js" type="text/javascript"></script>
<script src="BlockDiagEdit.js" type="text/javascript"></script>

In the load handler in the script file, setup the diagram properties and populate the node list with prototype containers and shape nodes, that will represent respectively systems and modules in our block diagrams:

Sys.Application.add_load(function (sender, args)
{
	// create a Diagram component that wraps the "diagram" canvas
	diagram = $create(Diagram, null, null, null, $get("diagram"));
	diagram.addEventListener(Events.nodeCreated, onNodeCreated);
	diagram.addEventListener(Events.linkCreated, onLinkCreated);
	diagram.setLinkHeadShapeSize(3);
	diagram.setLinkHeadShape("Alternative");
	diagram.setAllowInplaceEdit(true);

	// create a NodeListView component that wraps the "nodeList" canvas
	var nodeList = $create(MindFusion.Diagramming.NodeListView,
        null, null, null, $get("nodeList"));
	nodeList.setIconSize(new Size(48, 48));
	nodeList.setDefaultNodeSize(new Size(24, 24));

	var colors = [
		"#FF5555",
		"#55FF55",
		"#5555FF",
		"#FFFFFF"
	];

	// add container to the NodeListView to represent "system" blocks
	for (var i = 0; i < 4; ++i)
	{
		var node = new ContainerNode(diagram);
		node.setBrush(colors[i]);
		nodeList.addNode(node, "System " + (i + 1));
	}

	// add container to the NodeListView to represent "module" blocks
	for (var i = 0; i < 4; ++i)
	{
		var node = new MindFusion.Diagramming.ShapeNode(diagram);
		node.setShape("Rectangle");
		node.setBrush(colors[i]);
		nodeList.addNode(node, "Module " + (i + 1));
	}
});

Handle the nodeCreated event to make containers larger, and start inplace edit operation to let users enter text immediately after dropping a node:

function onNodeCreated(sender, args)
{
	var node = args.getNode();
	if (ContainerNode.isInstanceOfType(node))
	{
		// make containers larger
		var bounds = node.getBounds().clone();
		bounds.width = 100;
		bounds.height = 75;
		node.setBounds(bounds);
	}

	// let user enter text immediately
	diagram.beginEdit(node);
}

When there aren’t anchor points defined, the diagram control snaps link points to nearest point of nodes borders. Let’s automatically align points when links are created to make them straight horizontal or vertical lines if they are already close to being such. Otherwise leave points unchanged to let users draw diagonal lines too:

function onLinkCreated(sender, args)
{
	var link = args.getLink();
	var start = link.getStartPoint();
	var end = link.getEndPoint();

	// make link horizontal if close to being one
	if (Math.abs(start.x - end.x) > 10 && Math.abs(start.y - end.y) < 4)
	{
		end.y = start.y;
		link.setEndPoint(end);
	}

	// make link vertical if close to being one
	if (Math.abs(start.y - end.y) > 10 && Math.abs(start.x - end.x) < 4)
	{
		end.x = start.x;
		link.setEndPoint(end);
	}
}

Here’s the kind of block diagrams and flowcharts you can now draw:
Block diagram

The complete example can be downloaded from this link:
https://mindfusion.eu/_samples/BlockDiagEdit.zip

Enjoy!