Combine layout algorithms

Apply FractalLayout and SpringLayout to generate a tag cloud

In a series of posts we’ll explore ways to combine graph layout algorithms for various purposes, such as improving layout speed or achieving specific layout constraints.

In this topic we’ll show how to create a tag cloud using FractalLayout and SpringLayout algorithms from MindFusion diagramming API. You can download the complete project here:

TagCloud.zip

The sample code will show several features of the Diagram control:

  • FractalLayout
  • SpringLayout
  • custom node placement
  • text-only nodes

We assume words frequencies are already counted and listed as “word: frequency” entries in a sorted file. The example uses tags extracted from the contents of Wikipedia’s Tag cloud page. Let’s start by parsing the file and creating a node for each word. We’ll assign the word frequency to the Weight property of nodes for future reference. Weight is also used by some layout algorithms (such as TreeMapLayout for creating tree maps) that could visually represent word frequencies as well:

RectangleF defaultBounds = new RectangleF(0, 0, 10, 20);
ShapeNode root;
		
private void MainForm_Load(object sender, EventArgs e)
{
	// read the tags file
	var reader = new StreamReader("words.txt");
	string line;
	while ((line = reader.ReadLine()) != null)
	{
		// each line contains "word: frequency" entries
		var parts = line.Split(new[] { ':' });
		var word = parts[0];
		var frequency = int.Parse(parts[1]);

		// create a diagram node for each word in the file
		var node = diagram.Factory.CreateShapeNode(defaultBounds);
		node.Weight = frequency;
		node.Text = word;

		// set font size corresponding to frequency
		node.Font = new Font(
			"Arial",
			8 + (float)Math.Log(node.Weight, 1.15),
			GraphicsUnit.Point);

		// resize the node to fit text
		var size = TextRenderer.MeasureText(node.Text, node.Font);
		node.Resize(
			2 + (float)MeasureUnit.Pixel.Convert(size.Width, diagram.MeasureUnit, null),
			2 + (float)MeasureUnit.Pixel.Convert(size.Height, diagram.MeasureUnit, null));

		// show only text, hide geometry
		node.Transparent = true;
	}
}

Next, let’s build a tree that will distribute largest nodes roughly uniformly when arranged by FractalLayout, where larger parent nodes are circled by their smaller child nodes:

while ((line = reader.ReadLine()) != null)
{
	// ...
	if (diagram.Nodes.Count == 1)
	{
		// save reference to the first node
		root = node;
	}
	else
	{
		// build a tree where each node has up to six children
		diagram.Factory.CreateDiagramLink(
			diagram.Nodes[diagram.Nodes.Count / 6],
			node);
	}
}

// use FractalLayout for initial placement. if the file entries are sorted, each circular
// branch will contain larger parent node centered between its smaller children
new FractalLayout().Arrange(diagram);

If you run the application now, you should see the following layout:
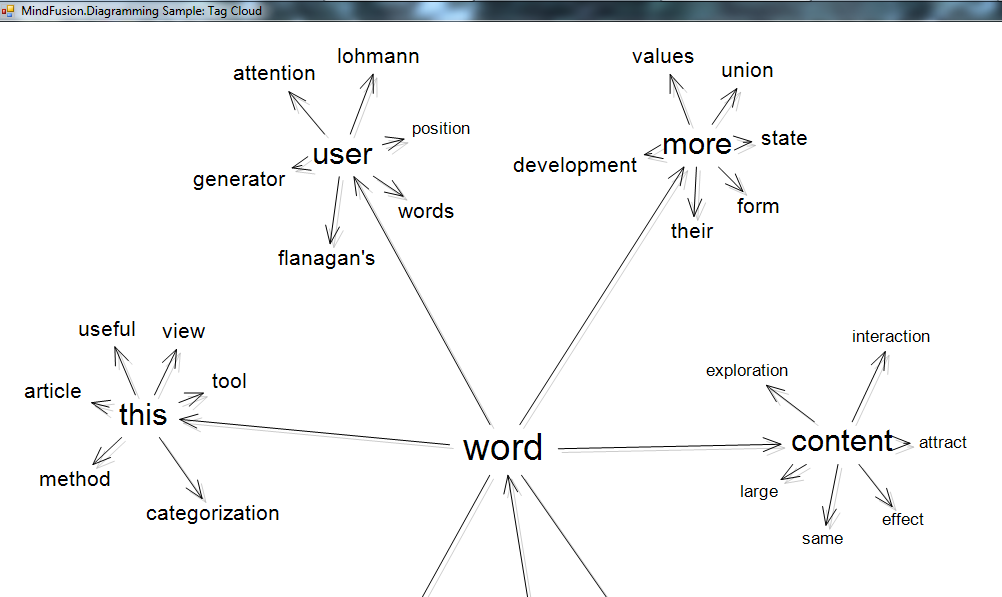
a tree arranged using fractal layout

FractalLayout allocates some space for links, and we’ll reclaim it by deleting the links and compressing the initial layout of nodes:

// remove the links
while (diagram.Links.Count > 0)
	diagram.Links.RemoveAt(diagram.Links.Count - 1);

// pull all nodes towards the root to eliminate empty space that was occupied by links
var center = root.GetCenter();
foreach (var node in diagram.Nodes.Where(n => n != root))
{
	var relativePos = new Vector(center, node.GetCenter());
	var newPos = center + relativePos / 10;
	node.Move(
		newPos.X - node.Bounds.Width / 2,
		newPos.Y - node.Bounds.Height / 2);
}

Now apply SpringLayout to make distances between closely placed nodes more uniform, running only a few iterations to complete faster:

// run SpringLayout to distribute nodes more uniformly
var sl = new SpringLayout();
sl.Randomize = false;
sl.SplitGraph = false;
sl.NodeDistance = 3;
sl.IterationCount = 40;
sl.Arrange(diagram);

Run the following method to remove any overlaps remaining after SpringLayout. RemoveOverlaps works by starting from specified node and offsetting any nodes that overlap it, continuing by spiraling away while processing other nodes. This method could also be useful in an interactive application if you want to disperse overlapping nodes introduced by the user when they move a node:

void RemoveOverlaps(DiagramNode modifiedNode, float minDist)
{
	var queue = new Queue();
	queue.Enqueue(modifiedNode);

	while (queue.Count > 0)
	{
		var node = queue.Dequeue();
		var nodeCenter = node.GetCenter();
		var overlaps = FindOverlaps(node, minDist);
		foreach (var overlap in overlaps)
		{
			var ovrCenter = overlap.GetCenter();
			var ovrBounds = overlap.Bounds;
			var dx = ovrCenter.X - nodeCenter.X;
			var dy = ovrCenter.Y - nodeCenter.Y;
			if (Math.Abs(dx) > Math.Abs(dy))
			{
				// offset horizontally
				if (dx < 0)
					ovrBounds.X = node.Bounds.Left - ovrBounds.Width - minDist;
				else
					ovrBounds.X = node.Bounds.Right + minDist;
			}
			else
			{
				// offset vertically
				if (dy < 0)
					ovrBounds.Y = node.Bounds.Top - ovrBounds.Height - minDist;
				else
					ovrBounds.Y = node.Bounds.Bottom + minDist;
			}

			// shifting the node might introduce new overlaps, continue processing
			overlap.Bounds = ovrBounds;
			queue.Enqueue(overlap);
		}
	}
}

List FindOverlaps(DiagramNode modifiedNode, float minDist)
{
	var bounds = modifiedNode.Bounds;
	bounds.Inflate(minDist - 1, minDist - 1);

	var overlaps = new List();
	foreach (var node in diagram.Nodes)
	{
		if (modifiedNode == node)
			continue;
		if (bounds.IntersectsWith(node.Bounds))
			overlaps.Add(node);
	}
	return overlaps;
} 

Finally run a few more iterations of SpringLayout to equalize distances again and zoom the diagram to show the whole tag cloud:

// remove any remaining overlaps
RemoveOverlaps(root, 0.1f);
sl.Arrange(diagram);

// show everything inside view
diagram.ResizeToFitItems(5);
diagramView.ZoomToFit();

If you run the application now, you should see the following image:
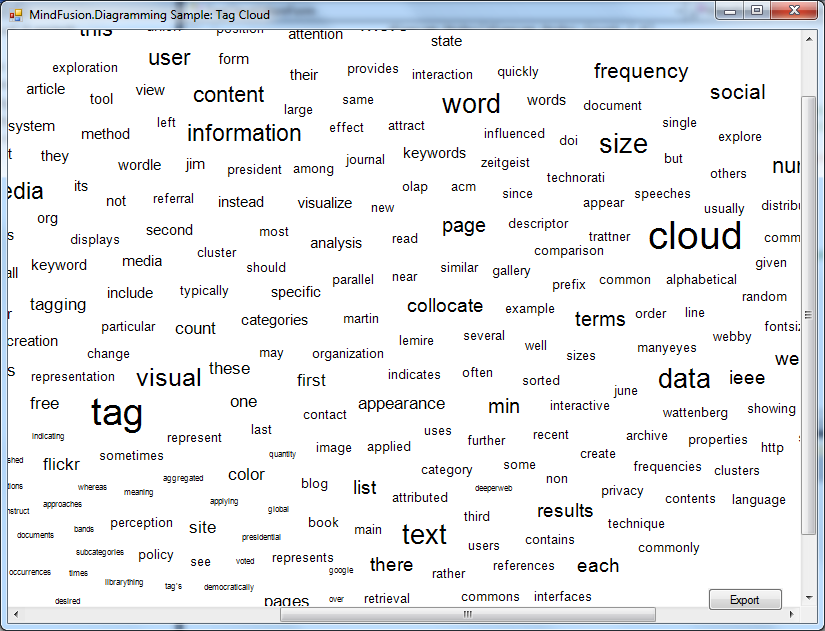
tag cloud generated using MindFusion diagram control

The code above uses MindFusion’s .NET API and can be used with Windows Forms, WPF, Silverlight and ASP.NET diagramming components. The Java API for Android and desktop Swing application will look similar, with setter method calls instead of property assignments.

You can download the trial version of any MindFusion.Diagramming component from this page.

Enjoy!

Creating a proprietary invoice editor

In this post we will show how to create an invoice editing application (using MindFusion.Reporting) for the end users of an organization. The source code of the sample is available for download from here:

https://mindfusion.eu/_samples/ReportingInvoiceEditor.zip

Introduction
We start off by creating a new Windows Forms Application in Visual Studio 2010 or later. Change the target framework of the application to “.NET Framework 4” (or later). The ReportEditor component that will be used as an in-place invoice editor requires at least .NET 4.

Add the ReportEditor component to the main form, set its Dock to Fill.

The invoice template
The invoice template displayed by the application is stored in an XML file. The original template is created beforehand and is located in Invoice.xml. All modifications to the template done by the end users will be stored back to the XML file upon exiting the application. Add the following line to the main form’s constructor to load the invoice template when the main form is constructed:

reportEditor1.OpenReport(@"Invoice.xml");

Adding the data source
From the “Data -> Add New Data Source…” menu in Visual Studio create a new data source from the nwind.mdb database. Select the Orders table and the Invoices query in the Data Source Configuration Wizard. In the XML Schema (nwindDataSet.xsd) ensure that there is a relation between the Orders and Invoices table adapters. The relation should link the OrderID fields of the two tables and should be named “Orders_Invoices”. Build the application so that Visual Studio creates the classes for the data set and the selected table adapters. Go back to the main form designer and add nwindDataSet, InvoicesTableAdapter, and OrdersTableAdapter components to the form. In the constructor of the form, add the following lines in order to fill the data set with the data from the source database:

invoicesTableAdapter1.Fill(nwindDataSet1.Invoices);
ordersTableAdapter1.Fill(nwindDataSet1.Orders);

In addition, we need to register the two tables as data sources in the report editor. This is essential because these data sources are used by the invoice report. It is also important that the data sources are registered before the report is initially loaded through the OpenReport method.

reportEditor1.AddDataSource(nwindDataSet1.Orders, "Orders");
reportEditor1.AddDataSource(nwindDataSet1.Invoices, "Invoices");

Saving the template
Override the OnClosing event of the form and add the following line to ensure that all changes to the invoice template are written back to the XML file:

reportEditor1.SaveReport(@"Invoice.xml");

Adding the menu
Create a menu strip for the application with the following structure:

  • File
    • Print
    • Print Preview
    • Exit
  • Edit
    • Undo
    • Redo

Add the following event handlers for the menu items:

private void printToolStripMenuItem_Click(object sender, EventArgs e)
{
	var printer = new ReportPrinter();
	printer.Report = reportEditor1.Report;
	printer.Report.Run();
	printer.Print();
}

private void printPreviewToolStripMenuItem_Click(object sender, EventArgs e)
{
	var printer = new ReportPrinter();
	printer.Report = reportEditor1.Report;
	printer.Report.Run();

	var preview = new PrintPreviewForm();
	preview.Document = printer;
	preview.ShowDialog();
}

private void exitToolStripMenuItem_Click(object sender, EventArgs e)
{
	Close();
}

private void undoToolStripMenuItem_Click(object sender, EventArgs e)
{
	reportEditor1.Undo();
}

private void redoToolStripMenuItem_Click(object sender, EventArgs e)
{
	reportEditor1.Redo();
}

The image below illustrates the running application:

reporting-invoiceeditor

The MindFusion.Reporting component can be downloaded from here:

https://www.mindfusion.eu/ReportingTrial.zip

Enjoy!

Database schema diagram

In this post we’ll show how to use TableNode objects to display tabular data, more specifically database schema information. A Visual Studio sample project containing the code from this post is available for download here:

DatabaseSchema.zip

To start, create a new Windows Forms application, and place a text field for connection string, a button and a DiagramView on the form. In the code-behind file, add following field to map table name to respective TableNode objects:

Dictionary<string, tablenode=""> tables = new Dictionary<string, tablenode="">();
</string,></string,>

Add a RectangleF that stores default size passed to CreateTableNode method:

RectangleF defaultSize = new RectangleF(0, 0, 30, 30);

Create a ReadTables method, which provided an SqlConnection, parses its schema information and creates diagram nodes:

void ReadTables(SqlConnection connection)
{
	// get table schema definitions from connection
	var schema = connection.GetSchema("Tables");
	foreach (DataRow row in schema.Rows)
	{
		// fetch table name
		var name = row["TABLE_NAME"].ToString();

		// create respective node
		var table = diagram.Factory.CreateTableNode(defaultSize);
		table.Caption = name;
		table.Shape = SimpleShape.RoundedRectangle;
		table.Brush = new MindFusion.Drawing.SolidBrush(Color.LightGray);

		// register node in dictionary for future foreign key reference
		tables[name.Replace(" ", "_")] = table;
		ReadFields(table, connection,
			row["TABLE_CATALOG"].ToString(), null, name);
	}

	ReadForeignKeys(connection);
}

The ReadFields method takes table node and name parameters and creates node cells that will show information for the column name and type of database tables:

void ReadFields(TableNode node,
	SqlConnection connection, string db, string owner, string tableName)
{
	// remove default cells
	node.RowCount = 0;

	// reserve one column for name and one for data type
	node.ColumnCount = 2;

	// read column definitions of specified table
	var schema = connection.GetSchema("Columns", new[] { db, owner, tableName });
	foreach (DataRow row in schema.Rows)
	{
		// add a new row to the node
		int r = node.AddRow();

		// set cells' text to the column name and type
		node[0, r].Text = row["COLUMN_NAME"].ToString();
		node[1, r].Text = row["DATA_TYPE"].ToString();

	}

	// make table cells big enough to show all text
	node.ResizeToFitText(false);
}

The ReadForeignKeys method creates DiagramLink connectors between table nodes to show the relationships between database tables:

void ReadForeignKeys(SqlConnection connection)
{
	var schema = connection.GetSchema("ForeignKeys");
	foreach (DataRow row in schema.Rows)
	{
		// read foreign key information
		string fkName = row["CONSTRAINT_NAME"].ToString();
		string tableName = row["TABLE_NAME"].ToString().Replace(" ", "_");
		string prefix = "FK_" + tableName + "_";
		if (fkName.StartsWith(prefix))
		{
			string targetName = fkName.Substring(prefix.Length);

			// get table nodes registered for specified names
			if (tables.ContainsKey(targetName) && tables.ContainsKey(tableName))
			{
				var table = tables[tableName];
				var targetTable = tables[targetName];

				// create a link between the nodes to show relationship
				diagram.Factory.CreateDiagramLink(table, targetTable);
			}
		}
	}
}

Finally handle the button’s click event to open specified connection and call ReadTables. Apply AnnealLayout to arrange the tables so that they do not overlap:

private void btnOpen_Click(object sender, System.EventArgs e)
{
	diagram.ClearAll();

	try
	{
		var connection = new SqlConnection(tbConnection.Text);
		connection.Open();

		// read schema and create corresponding diagram items
		ReadTables(connection);

		connection.Close();
	}
	catch (Exception exception)
	{
		MessageBox.Show(exception.Message);
		diagram.ClearAll();
	}

	// arrange the tables to remove overlaps
	var layout = new AnnealLayout();
	layout.SplitGraph = true;
	layout.Randomize = false;
	layout.MultipleGraphsPlacement = MultipleGraphsPlacement.MinimalArea;
	layout.Margins = new SizeF(10, 10);
	layout.Arrange(diagram);
}

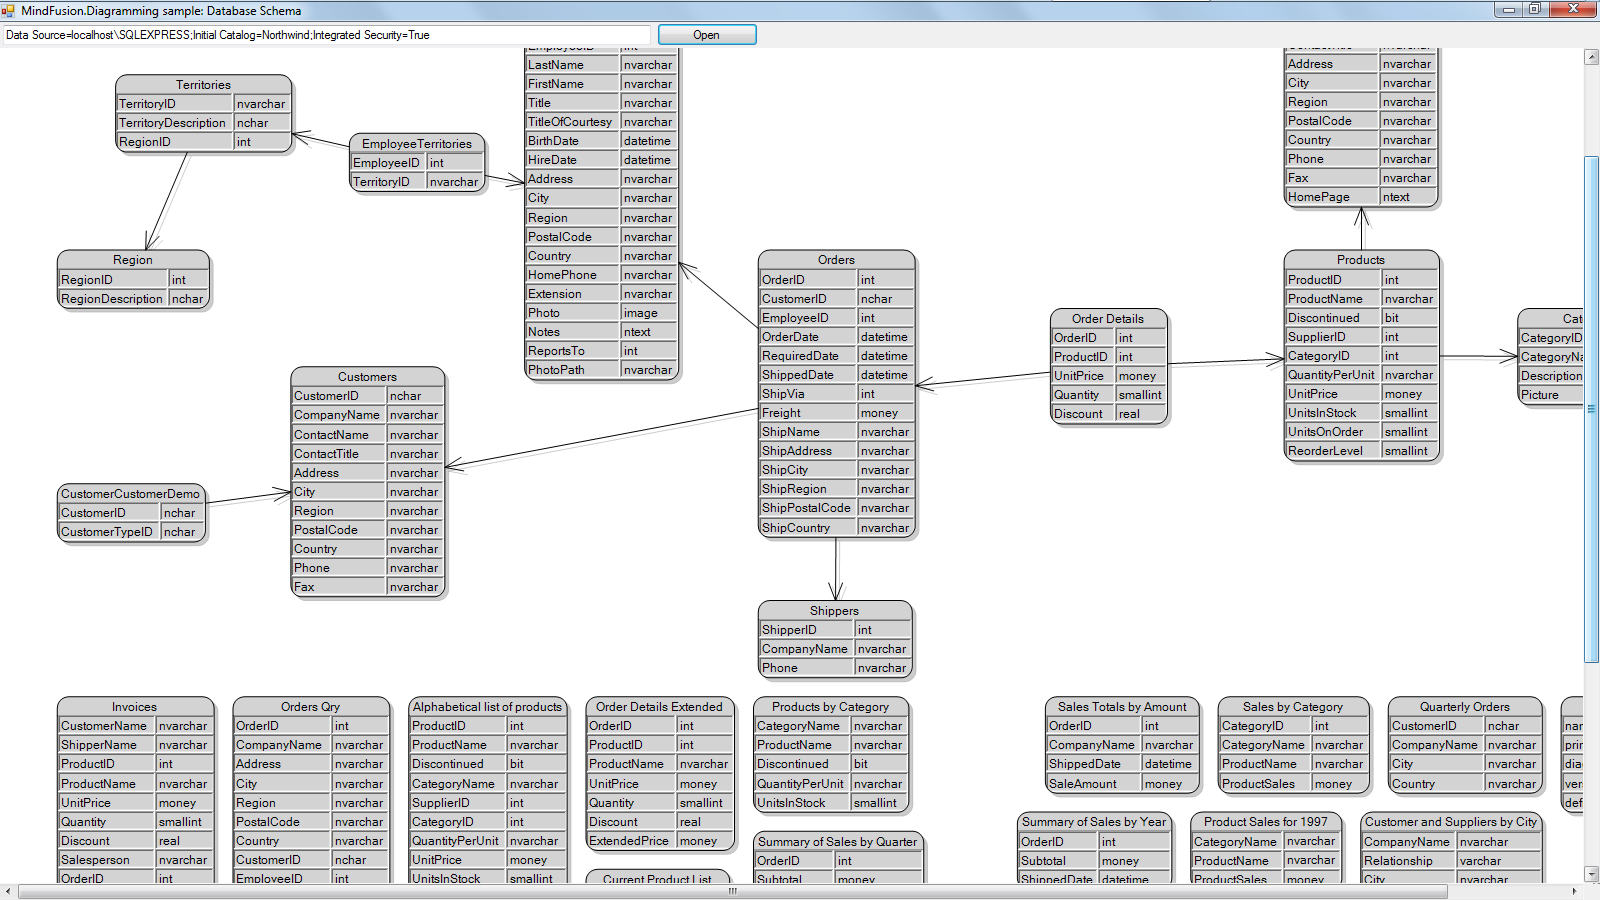
If you run the project and open the Northwind sample database by Microsoft, you should see this diagram:

database schema layout

The code above uses MindFusion’s .NET API and can be used with Windows Forms, WPF, Silverlight and ASP.NET diagramming components. The Java API for Android and desktop Swing application will look similar, with setter method calls instead of property assignments.

You can download the trial version of any MindFusion.Diagramming component from this page.

Enjoy!
MindFusion Charting for WinForms, V3.6

MindFusion has released a new version of its Charting for WinForms programming control. Here is an overview of the most important new features:

Custom Formatting of Labels
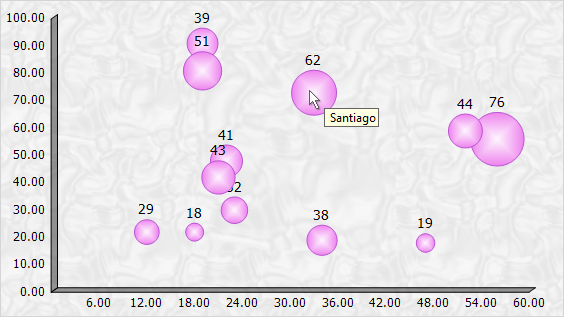
You can now use custom formatting for numeric labels for all chart types. The formatting is applied when you set the format of the label to NumberFormat.Custom. The properties that set the custom number format use the .net custom format strings.

Labels in a WinForms bar chart

Labels in a WinForms bar chart

Sorting of Bars
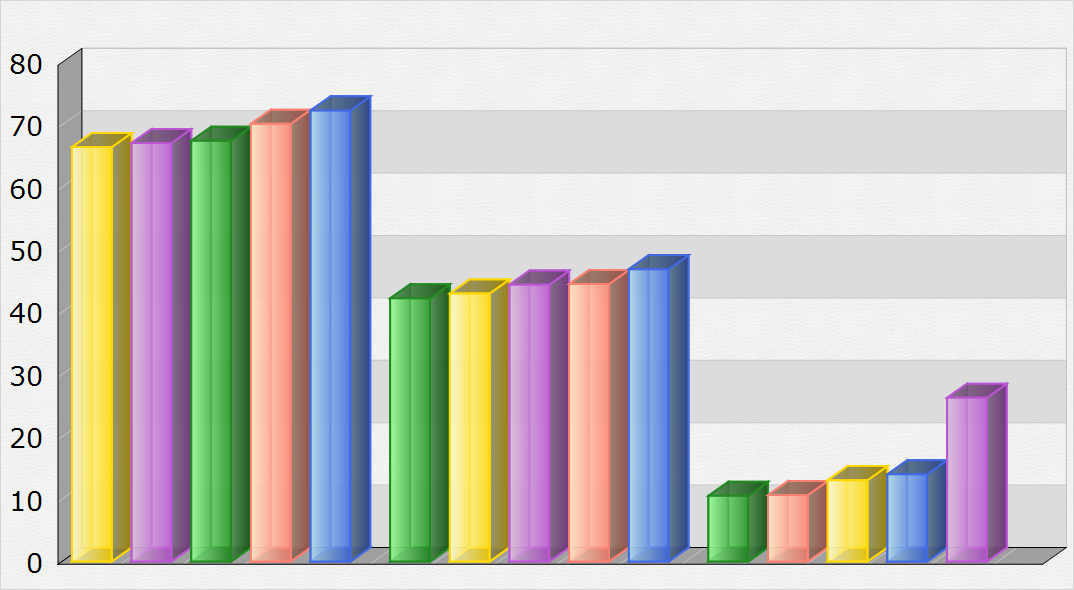
MindFusion WinFormsCharting control offers you greatly improved sorting of bar values in a bar chart. You can use the SortOrder property to sort the bars in each series or cluster in ascending or descending order. You can also sort each series/cluster with the SortSeriesBy property. You can preserve the color of each bar when sorted if you set the SortColor property to true.

A WinForms chart with sorted bars.

A WinForms chart with sorted bars.

License keys
MindFusion no longer provides separate trial and licensed versions of its components. Instead, you should set the LicenseKey property to disable the component’s evaluation mode and stop displaying trial messages. If your application has more than one Diagram instance or other controls by MindFusion, a single call to MindFusion.Licensing.LicenseManager.AddLicense(key) is enough to specify the key for all the controls. You can find your license key strings listed on the Keys & Downloads page at your http://clientsarea.eu account.

Miscellaneous

  • Bars are now outlined with the consecutive pen from the ChartPens collection rather than the AxisPen.
  • Drawing of line and area charts has greatly been improved – the control now draws only the visible portion of the chart rather than the whole chart, which was clipped to the visible rectangle.
  • AreaOpacity property added to radar charts.
  • AxesOnTop property in radar charts sets the order of drawing for the graphic and the axes.
  • SortYData and SortXData properties added to line charts.
  • In line charts colors can be sorted with line series or scatters when those get sorted.

The trial version is available for direct download from this link:

Download MindFusion.Charting for WinForms 3.6

Technical support is available at the forum, help desk or at e-mail support@mindfusion.eu. All inquiries are answered within hours of being received.

About MindFusion.Charting for WinForms: a professional programming component for WinForms, which lets you create remarkable charts fast and easy. The tool supports all major chart types – line, pie, radar and bar – and numerous variations of them – column, area, bubble, polar, doughnut etc. 3D charts are supported as well.

Charting for WinForms supports a rich user interaction model with features like zoom, hit testing, drill down, mouse dragging and more. You can use delegates to present mathematical functions, undefined values are also acceptable. Values can be data arrays or retrieved through a database.

The appearance of each chart is fully customizable. The control offers strong design-time support with custom collection editors and chart wizards. At your disposal is a set of predefined appearance themes and a theme editor tool. A full list of the features can be read here.

Combine layout algorithms

Apply TreeLayout twice to arrange a genealogy tree

In a series of posts we’ll explore ways to combine graph layout algorithms for various purposes, such as improving layout speed or achieving specific layout constraints.

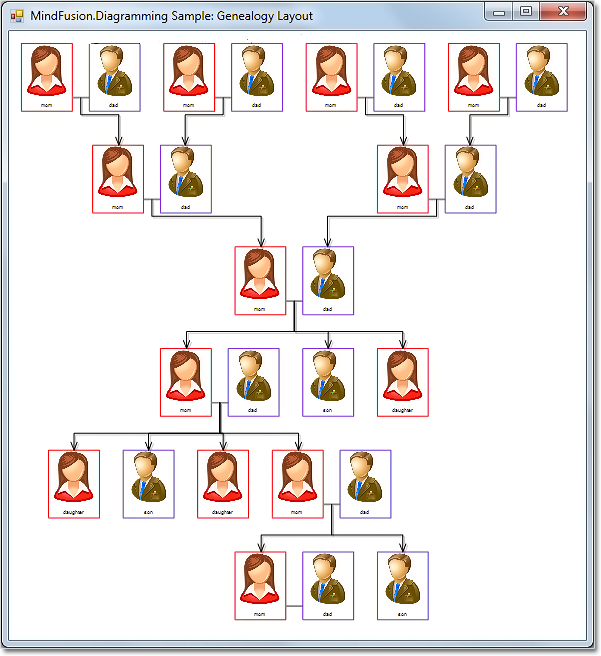
In this example we’ll show how to apply two TreeLayout instances with different settings to arrange a genealogy tree. The genealogy tree is focused on specific person, with several levels of ancestors drawn above and descendants drawn below. A Visual Studio sample project containing the code from this post is available for download here:

GenealogyLayout.zip

As a start, let’s define a new node class that will draw a person’s photo and name inside a frame, along with their partners’. This will simplify our layout code since we won’t have to take care of keeping partner nodes close to each other:

class GenealogyNode : DiagramNode
{
	public List Partners { get; set; }

	public override void DrawLocal(IGraphics graphics, RenderOptions options)
	{
		float relationLinkLen = Bounds.Width / 7;
		int relations = Partners.Count - 1;
		float personViewWidth = Bounds.Width - relations * relationLinkLen;
		personViewWidth /= Partners.Count;

		var rect = GetLocalBounds();
		rect.Width = personViewWidth;
		for (int i = 0; i < Partners.Count; i++)
		{
			DrawPerson(Partners[i], graphics, rect);

			if (i < Partners.Count - 1)
			{
				float rx = rect.Right;
				float ry = rect.Y + 4 * rect.Height / 5;
				rect.X += personViewWidth + relationLinkLen;
				graphics.DrawLine(Pens.Gray, rx, ry, rect.X, ry);
			}
		}
	}

	public override void DrawShadowLocal(IGraphics graphics, RenderOptions options)
	{
	}

	void DrawPerson(Person person, IGraphics graphics, RectangleF rect)
	{
		const float labelHeight = 5;
		const float padding = 3;

		// draw name
		var labelRect = RectangleF.FromLTRB(
			rect.Left,
			rect.Bottom - labelHeight,
			rect.Right,
			rect.Bottom);

		graphics.DrawString(person.Name,
			EffectiveFont, Brushes.Black, labelRect,
			new StringFormat { Alignment = StringAlignment.Center });

		// draw image
		var imageRect = rect;
		imageRect.Height -= labelHeight + padding;

		Utilities.DrawImage(graphics, person.Image, imageRect, ImageAlign.Fit);

		// draw frame
		var frameColor = person.Gender == Gender.Female ?
			Color.Red : Color.BlueViolet;
		var framePen = new System.Drawing.Pen(frameColor, 0);
		graphics.DrawRectangle(framePen, rect);
		framePen.Dispose();
	}
}

Alternatively, we could draw a single person per node instead, placing partners’ nodes close to each other, grouping them using AttachTo method, and later running TreeLayout with its KeepGroupLayout property enabled.

Now to generate a sample tree, we’ll define recursive methods that will create specified number of ancestor pairs (GenerateAncestors) and create random number of descendants (GenerateDescendants):

void GenerateAncestors(GenealogyNode node, int levels)
{
	if (levels == 0)
		return;
	for (int i = 0; i < 2; i++)
	{
		var p = AddPair();
		var link = diagram.Factory.CreateDiagramLink(p, node);
		link.DestinationAnchor = i;
		link.OriginAnchor = 2;
		GenerateAncestors(p, levels - 1);
	}
}

void GenerateDescendants(GenealogyNode node, int levels)
{
	if (levels == 0)
		return;
	int children = random.Next(1, 5);
	for (int i = 0; i < children; i++)
	{
		int r = random.Next(0, 3);
		if (r == 2)
		{
			var p = AddPair();
			var link = diagram.Factory.CreateDiagramLink(node, p);
			link.OriginAnchor = 2;
			link.DestinationAnchor = 0;
			GenerateDescendants(p, levels - 1);
		}
		else if (r == 1)
		{
			var p = new Person { Name = "daughter", Gender = Gender.Female, Image = fImage };
			var childNode = AddNode(p);
			diagram.Factory.CreateDiagramLink(node, childNode);
		}
		else if (r == 0)
		{
			var p = new Person { Name = "son", Gender = Gender.Male, Image = mImage };
			var childNode = AddNode(p);
			diagram.Factory.CreateDiagramLink(node, childNode);
		}
	}
}

GenealogyNode AddPair()
{
	var p1 = new Person { Name = "mom", Gender = Gender.Female, Image = fImage };
	var p2 = new Person { Name = "dad", Gender = Gender.Male, Image = mImage };
	return AddNode(p1, p2);
}

GenealogyNode AddNode(Person p)
{
	var bounds = new RectangleF(0, 0, 30, 40);

	var node = new GenealogyNode();
	node.Bounds = bounds;
	node.Partners = new List { p };
	node.AnchorPattern = AnchorPattern.TopInBottomOut;
	diagram.Nodes.Add(node);
	return node;
}

GenealogyNode AddNode(Person p1, Person p2)
{
	var bounds = new RectangleF(0, 0, 70, 40);

	var node = new GenealogyNode();
	node.Bounds = bounds;
	node.Partners = new List { p1, p2 };
	node.AnchorPattern = PairPattern;
	diagram.Nodes.Add(node);
	return node;
}

Finally we run TreeLayout twice with specified root node, arranging ancestor nodes above the root and descendant nodes below it, creating the genealogy drawing shown below:

private void GenealogyForm_Load(object sender, EventArgs e)
{
	var root = AddPair();
	GenerateAncestors(root, 2);
	GenerateDescendants(root, 3);

	var l1 = new TreeLayout();
	l1.ReversedLinks = true;
	l1.Direction = TreeLayoutDirections.BottomToTop;
	l1.Anchoring = Anchoring.Keep;
	l1.LevelDistance *= 2;
	l1.NodeDistance *= 1.4f;
	l1.LinkStyle = TreeLayoutLinkType.Cascading3;
	l1.Arrange(diagram);

	var l2 = new TreeLayout();
	l2.Root = root;
	l2.KeepRootPosition = true;
	l2.Anchoring = Anchoring.Keep;
	l2.LevelDistance *= 2;
	l2.NodeDistance *= 1.4f;
	l2.LinkStyle = TreeLayoutLinkType.Cascading3;
	l2.Arrange(diagram);

	diagram.ResizeToFitItems(5);
	//diagramView.ZoomToFit();
}

genealogy tree layout

The code above uses MindFusion’s .NET API and can be used with Windows Forms, WPF, Silverlight and ASP.NET diagramming components. The Java API for Android and desktop Swing application will look similar, with setter method calls instead of property assignments.

You can download the trial version of any MindFusion.Diagramming component from this page.

Enjoy!