MindFusion has released Pack for ASP.NET, V2013.R2. Here is an overview of the most important new features in the components within the pack:
![]() MindFusion.Diagramming for WebForms
MindFusion.Diagramming for WebForms
Import of OpenOffice Draw files
The new DrawImporter class lets you import *.odg files created by the OpenOffice Draw Vector graphics editor. You just need to add a reference to the MindFusion.Diagramming.Import.Draw.dll assembly and are ready to use it. You can use various overloads of the Import method to import the OpenOffice drawing into a DiagramDocument whose pages correspond to the Draw pages, or into a single Diagram whose content is merged from all imported pages.
Import any type of diagram from an *.odg file
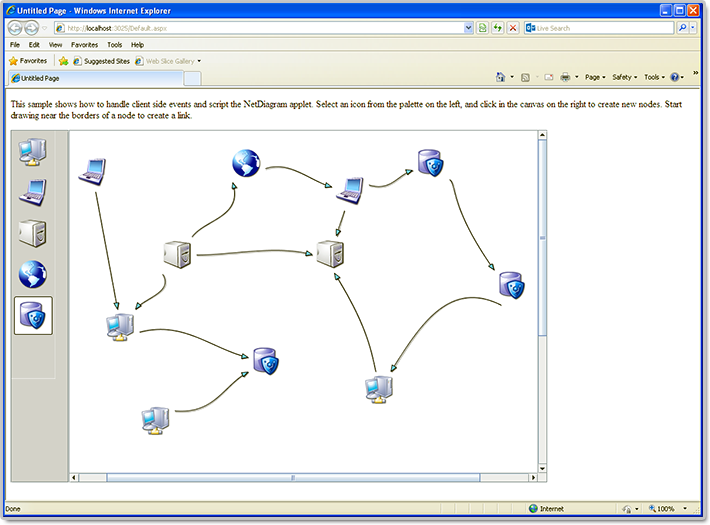
Canvas Mode Improvements
- Glass and Aero visual effects
- Radial gradients
- Support for custom node types
- Multiple labels per link
- The CanvasVirtualScroll property of DiagramView enables virtual scroll mode.
- NodeSelectedScript and LinkSelectedScript client-side events and many more
ContainerNode Improvements
- Child nodes are now drawn by their containers; when containers overlap, the children of a lower container cannot appear in front of the upper container anymore
- The ClipChildren property specifies whether to clip child items to container’s boundaries
- The ZIndex property no longer changes automatically when dropping nodes into a container
- and others
Miscellaneous
- The MeasureUnit property now supports Centimeter and WpfPoint values. The latter allows loading diagram files saved by WPF and Silverlight versions of the control with their default units.
- SwimlaneLayout now honors the Anchoring.Keep property value.
- New line and quote characters in Tag strings are now escaped when passed to client-side click events in ImageMap mode, avoiding script errors.
- As well a few bug fixes and API changes
![]() MindFusion.Charting for WebForms
MindFusion.Charting for WebForms
Themes
Chart themes are now XML files that you can save and load with the SaveTheme and LoadTheme methods. You can use the theme editor tool provided with the control to edit, save and load themes in a fast and intuitive way. The control provides an initial set of 8 predefined themes.
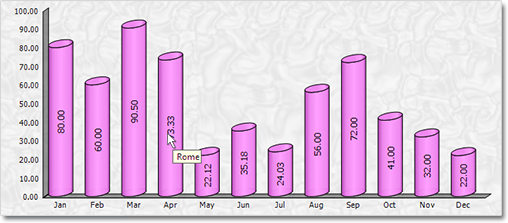
Major/Minor Axis Ticks
Use the new MajorTickLength and MinorTickLength properties to divide a chart axis in a more precise and accurate manner. The number and pen for the ticks are set with MinorTicksPerInterval, MajorTickPen and MinorTickPen.
Major and minor axis ticks
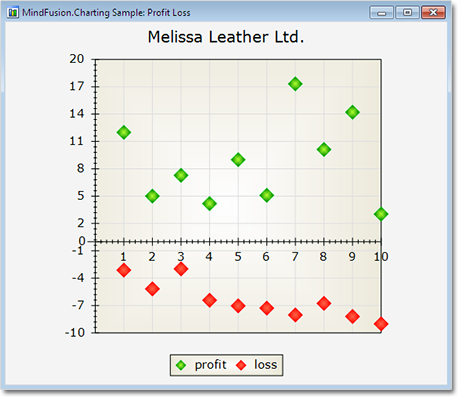
ToolTips
You can apply tooltips on all chart types. Area charts in particular can show a different tooltip for every region between two adjacent data points.
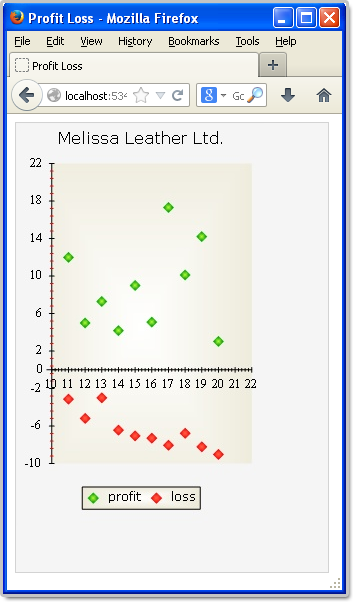
Interactive Editing of Data
Line and bar chart elements can be dragged with the mouse. Bars can be dragged either in horizontal or vertical direction according to their orientation. Line chart points can be dragged in any direction. The dragging behavior is set with the Behavior property.
As well other useful new features.
You can read more about the new features of the components in the ASP.NET Pack at the forum. The new version is available for download from this link:
Download MindFusion Pack for WebForms, VR2.2013
About MindFusion.WinForms Pack: A set of WebForms components that add great variety of features to your ASP.NET application with a few mouse clicks. The pack contains advanced components for diagramming, scheduling, charting and UI (Accordion, ColorPicker, TabControl, Window, WindowHost, DockControl, Button, Slideshow, Zoom and more). Each tool boasts easy to learn and use API and is quickly integrated into any web application that targets the ASP.NET platform. The controls support numerous options for styling, data import / export, user interaction and offer rich event set. There are plenty of samples and step-by-step tutorials as well detailed documentation.
Use the features page for each of the tools to find out more about its capabilities and
the numerous ways it can boost your performance and speed up the development of your application:
- Diagramming for ASP.NET
- Scheduling features page
- Charting features page
- and UI (Accordion, ColorPicker, TabControl, Window, WindowHost, DockControl, Button, CheckBox, Radio, Slideshow, Zoom and many more).
Visit the buy page for details on the licensing scheme and prices. If you have questions please contact us. We shall be happy to assist you.