Diagramming for WinForms V.6.0.3

MindFusion has just released a new version of its popular Diagramming component for WinForms. The new features are mostly requested by the users. Here is a list:

ContainerNode Improvements

  • Each container now draws its child nodes. When containers overlap, the children of the lower container can’t appear above the children of the upper container any more.
  • The ClipChildren property indicates whether to clip child items to container’s boundaries
  • The ZIndex property no longer changes automatically when dropping nodes into a container
  • and more
Container nodes

Container nodes

PdfExporter Improvements

  • Clip regions are handled better in custom drawing code
  • PDF shadings now include all colors from a ColorBlend
  • More precise character width when text includes both eastern glyphs and Latin characters.
  • and more.

New events

  • The SetSelfLoopShape event is raised when a link becomes a self-loop, giving you a chance to set a custom shape for the link.
  • The QueryAlignTarget event is raised to determine if a node should be used as alignment guide target when AutoAlignNodes is enabled.
Differently formatted text.

Differently formatted text.

As well other new properties, methods and features – you can read the full list here.

A trial version of the component is available from this link:

Diagramming for WinForms 6.0.3

If you have questions or run into problems using the component you can use the Diagramming for WinForms forum, the help desk or write us at support@mindfusion.eu. Our support team will be pleased to help you.

About MindFusion.Diagramming for WinForms: A programming component that provides any WinForms application with a full set of features for creating and customizing all types of diagrams, flowcharts, schemes, hierarchies, trees, graphs etc. The control provides numerous ways to save and load a diagram, six auxiliary controls and more than 10 automatic graph layout algorithms. Diagram elements include scrollable tables, container nodes, multi-segment arrows, custom diagram item types and many more. Further details here.

Diagramming for WinForms is a royalty-free component, clients get 12 month upgrade subscription when buying a license. The source code is also available for purchase. Visit the buy page for a list with the current license prices.

Custom items in Silverlight reports

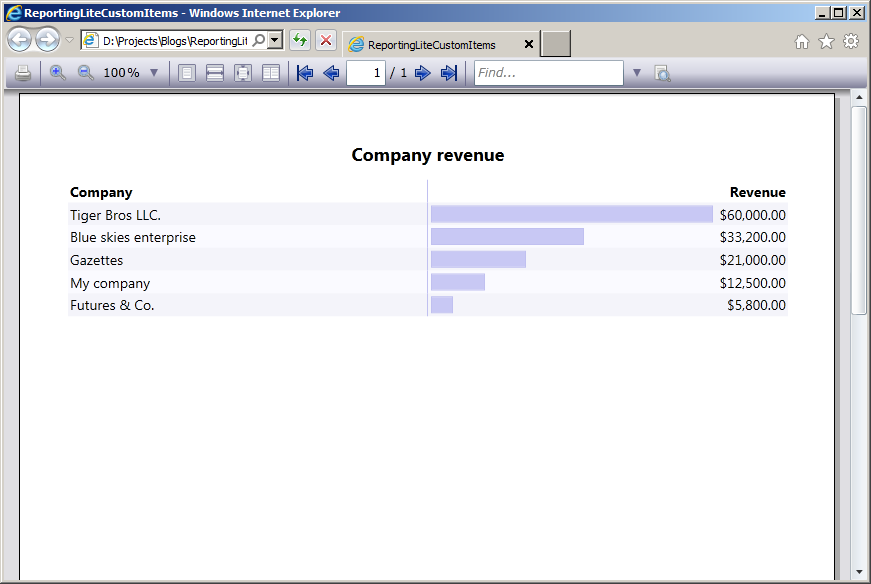
In this post we will examine how to use custom items in MindFusion reports in Silverlight. The report in question will display the revenue of several companies, sorted in descending order. The custom items will visualize the relative revenue value of each company as a graphics similar to a chart.

To start off, we will define our business objects – a CompanyInfo class with two properties – Name and Revenue, of type string and double respectively.

public class CompanyInfo
{
  public string Name { get; set; }
  public double Revenue { get; set; }
}

Then we will declare sample data – an array of several companies, sorted by revenue:

var companyInfo = new CompanyInfo[]
{
  new CompanyInfo { Name = "My company", Revenue = 12500 },
  new CompanyInfo { Name = "Blue skies enterprise", Revenue = 33200 },
  new CompanyInfo { Name = "Futures & Co.", Revenue = 5800 },
  new CompanyInfo { Name = "Gazettes", Revenue = 21000 },
  new CompanyInfo { Name = "Tiger Bros LLC.", Revenue = 60000 },
}.OrderByDescending(info => info.Revenue);

The actual report is placed inside Resource Dictionary (named MyReport.xaml). The report contains a title and a single data range with three columns – for company name, revenue graphics and revenue value respectively. The actual report is omitted for brevity, but the code of the custom item representing the revenue graphics is shown below:

<report:CustomReportItem Location="50%,0" Size="40%,6" Value="[100*Revenue/Max(&quot;Revenue&quot;)]">
  <report:CustomReportItem.Template>
    <DataTemplate>
      <Grid>
        <Grid.ColumnDefinitions>
          <ColumnDefinition Width="{Binding Converter={StaticResource gridLengthConverter}}" />
          <ColumnDefinition Width="{Binding Converter={StaticResource gridLengthConverter}, ConverterParameter='-'}" />
        <ColumnDefinition />
        <Border BorderBrush="#C0C0F0" BorderThickness="1" Background="#C8C8F4" Margin="3" />
      </Grid>
    </DataTemplate>
  </report:CustomReportItem.Template>
</report:CustomReportItem>

The value of the custom item is calculated as the percentage of the company revenue relative to the maximum revenue amongst all companies. The content of the custom item represents a grid with two columns. The first column contains the border that is used as the representation of the revenue graphics. The width of the columns is calculated according to the item value by using a custom value converter – GridLengthConverter. The GridLengthConverter basically converts the value to a GridLength object with GridUnitType set to Star.

The report is loaded from the resource dictionary using the helper Report.FromDictionary method, then setup with the data and run:

var report = Report.FromDictionary(new Uri("ReportingLiteCustomItems;component/MyReport.xaml", UriKind.Relative), "myReport");
report.DataContext = companyInfo;
report.QueryDetails += (s, e) => e.Details = companyInfo;
report.Run()

Note, that the sample handles the QueryDetails event. This is done in order to supply data to the Max aggregate function used inside the CustomReportItem.Value expression.

Finally, the report is selected inside a ReportViewer on the main form:

viewer.Document = report;

The following image shows the running sample:

The source code is available for download from here:

Download the Complete Source Code for the Sample

You can get the trial version of MindFusion.Reporting for Silverlight from this link:

Download MindFusion.Reporting for Silverlight Trial Version

Working Hours Bar Chart in WinForms

In this post we will explore how to create a bar chart that shows the weekly working hours for each
member of a team. We use MindFusion.Charting for WinForms component.

The Type of the Bar Chart

We decide to use a horizontal bar chart, which will give a clear visual representation of the data in this case. We use the BarType property to choose the bar type and set the Horizontal property:

barChart1.Horizontal = true;
barChart1.BarType = MindFusion.Charting.BarType.Single3D;

A 3D chart would look more sophisticated so we choose “Single3D” for a BarType.

The Data

We don’t need to set data for both axes – one is enough. The control automatically sets values for the
other axis to make the bars equally distributed. We can write the data by hand or use the built-in
design time collection editor:


barChart1.Data.Add(new List() { 82, 60, 73, 45, 19, 34, 58, 23, 69, 17 });

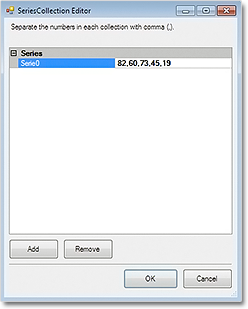
The data collection editor

The data collection editor

The Axes

The X-axis shows a scale of the total working hours for the week. We set its LabelType to “AutoScale
and set the interval to 10:

barChart1.XAxisSettings.LabelType = MindFusion.Charting.AxisLabelType.AutoScale;
barChart1.XAxisSettings.AxisDelta = 10;

This is the only axis that shows numbers on the chart, so we show the starting zero number:

barChart1.XAxisSettings.DrawZero = true;

We want to show whole numbers at the axis – no decimal fractions – and we use the NumberFormat property to set this:

barChart1.XAxisSettings.NumberFormat = MindFusion.Charting.NumberFormat.Fixed_point_0Digits;

Finally, we set the title:

barChart1.XAxisSettings.TitleLabel = "Total Weekly Hours";

For the Y-axis we want to show custom labels – the name of each employee. We use the YLabels property to specify the labels and set YAxisSettings.LabelType to the appropriate value:

barChart1.YAxisSettings.LabelType = MindFusion.Charting.AxisLabelType.CustomText;
barChart1.YLabels.Add(new List() { "Mary Johnson", "Tim Davidson", "Alan Hank", "Elisa Labate", "Boris Foster", "Tim Carnes", "Olivia Beverling", "Mark Buchanan", "Ron Callary", "Cindy Peterson" });

The Grid

A vertical grid will help us identify the value of each bar. The GridType property, together with the
GridBrush and AltGridBrush help use set the type and colors of the grid. We outline the plot area with PlotAreaOutline:

GridType = MindFusion.Charting.GridType.VertScale;
barChart1.GridBrush = new MindFusion.Drawing.SolidBrush(Color.White);
barChart1.AltGridBrush = new MindFusion.Drawing.SolidBrush(Color.FromArgb(240, 240, 240));
PlotAreaOutlinePen = new MindFusion.Drawing.Pen(Color.FromArgb(220, 220, 220));

The Bar Colors

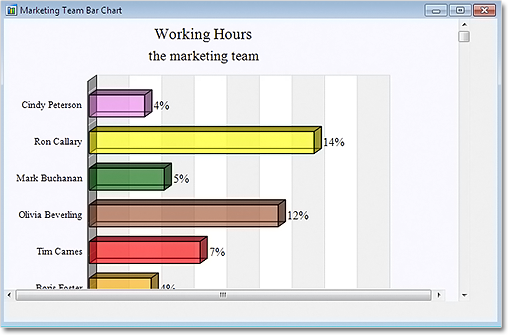
We use ChartBrushes and ChartPens to specify how our bars will be colored. Here is the final chart:

3D BarChart in .NET WinForms

3D BarChart in .NET WinForms

Scrolling the chart:

We set the ResizeType to “Scrollable“. This way we can scroll to see all data on the chart without the need to increase the size of the chart and let it take too much space.

barChart1.ResizeType = MindFusion.Charting.WinForms.ResizeType.Scrollable;

The sample is available for download from here:

Download WinForms Working Hours Bar Chart Sample

A trial version of MindFusion.Charting for WinForms is available from here:

Download MindFusion.Charting for WinForms

Implementing drag & drop in MindFusion.Scheduling for WPF

In this post we will discuss how to implement drag & drop using MindFusion.Scheduling for WPF. The goal is to enable users to create appointments by dragging items from an external source and dropping them onto the Calendar control surface.

The source

For the purposes of this sample the drag & drop source would be a simple ListBox control. The following XAML declares a ListBox with several predefined items:

  Task #1
  Task #2
  Task #3
  Task #4
  Task #5
  Task #6

The calendar

To enable the Calendar control to be the target of drag & drop operations, set its AllowDrop property to true. The following XAML snippet illustrates the definition of the Calendar control:

<planner:calendar x:name="calendar" grid.column="1" currentview="ResourceView" grouptype="GroupByResources" theme="Silver" allowdrop="True">
  <planner:calendar.itemresources>
    <planner:resource name="Resource #1">
    <planner:resource name="Resource #2">
    <planner:resource name="Resource #3">
  </planner:resource></planner:resource></planner:resource></planner:calendar.itemresources>
</planner:calendar>

The calendar is set up to display three resources in a Resource view.

The drag & drop

The drag & drop operation is initiated by calling the DragDrop.DoDragDrop static method and passing a reference to the dragged data. In our case we would want to initiate drag & drop when the user clicks on an item in the ListBox and starts dragging. Because the MouseDown event is consumed by the ListBox when the mouse is pressed over an item, we need to handle the PreviewMouseDown event. The following C# code displays the handlers of the PreviewMouseDown and MouseMove events:

private void taskList_PreviewMouseDown(object sender, MouseButtonEventArgs e)
{
  mouseDown = e.LeftButton == MouseButtonState.Pressed;
}

private void taskList_MouseMove(object sender, MouseEventArgs e)
{
  if (taskList.SelectedItem != null && mouseDown)
  {
    mouseDown = false;
    string data = ((ListBoxItem)taskList.SelectedItem).Content.ToString();
    DragDrop.DoDragDrop(taskList, data, DragDropEffects.Copy);
  }
}

To give visual feedback to the user when the mouse moves over the Calendar control during drag & drop operation, handle the DragOver event:

private void calendar_DragOver(object sender, DragEventArgs e)
{
  e.Effects = DragDropEffects.None;
  if (e.Data.GetDataPresent(typeof(string)))
  {
    DateTime? date = calendar.GetDateAt(e.GetPosition(calendar));
    if (date != null)
      e.Effects = DragDropEffects.Copy;
  }
}

This handler checks whether the dragged data matches the expected type and whether the location under the mouse cursor represents a valid date.

Finally, handle the Calendar.Drop event. This event is raised when the user releases the mouse over the Calendar control during a drag & drop operation.

private void calendar_Drop(object sender, DragEventArgs e)
{
  if (e.Data.GetDataPresent(typeof(string)))
  {
    Point point = e.GetPosition(calendar);
    DateTime? date = calendar.GetDateAt(point);
    Resource resource = calendar.GetResourceAt(point);
    if (date != null && resource != null)
    {
      string task = (string)e.Data.GetData(typeof(string));
      Appointment appointment = new Appointment();
      appointment.HeaderText = task;
      appointment.StartTime = date.Value;
      appointment.EndTime = appointment.StartTime.AddDays(2);
      appointment.Resources.Add(resource);
      calendar.Schedule.Items.Add(appointment);
    }
  }
}

The following image shows the running sample with several created appointments:

Drag & drop

The source code is available for download from here:

Download the Complete Source Code for the Sample

You can get the trial version of MindFusion.Scheduling for WPF from this link:

Download MindFusion.Scheduling for WPF Trial Version

Diagramming for WinRT Beta Version

We have almost finished the initial release of MindFusion.Diagramming component for WinRT. The release
implements most of the API of the MindFusion.Diagramming for Silvelright component. You can read the online reference here:

Diagramming for Silvelright Online Reference

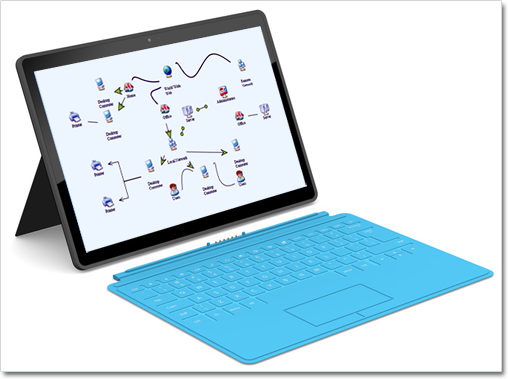
MindFusion.Diagramming for WinRT

MindFusion.Diagramming for WinRT

The Magnifier and Overview controls as well the printing functionality are currently not supported.
Single-touch events are equivalent to mouse input in the Silverlight control. Additionally, the WinRT library implements the following multi-touch gestures:

  • dragging two fingers in same direction over a node translates it
  • dragging two fingers in opposite directions over a node scales and/or rotates it
  • dragging two fingers over an unoccupied point pans the diagram

If the diagram is inside a ScrollViewer, multi-touch gestures are handled only if the ManipulationMode property is set to None; otherwise they are intercepted by the parent ScrollViewer control.

When adding references to the MindFusion.* assemblies, their accompanying resource folders (MindFusion.Diagramming and MindFusion.Diagramming.Controls) must be in the same location as the dll files. If copying or moving the diagramming.dll assemblies, you must also copy these folders in order for Visual Studio to discover the necessary resources.

You are welcome to download and test the beta version:

MindFusion.Diagramming for WinRT Beta Version

Your feedback is highly appreciated. You can write your reviews at the forum or at support@mindfusion.eu.
Thank you.