Diagramming for ASP.NET MVC, V1.6

MindFusion is pleased to announce a new release of its Diagramming component for ASP.NET MVC. Here is an overview of the new features:

Import of OpenOffice Draw files

You can now import .odg files, created by the OpenOffice Draw vector graphics editor. Various overloads of the Import method can be used to import the OpenOffice drawing into a DiagramDocument, whose pages correspond to the Draw pages or into a single Diagram, whose content is merged from all important pages. The new DrawImporter class supports shapes from the General and Flowchart shape palettes in Draw. For each node and connector shape, the importer creates a matching ShapeNode or DiagramLink object and sets their properties in such manner that the source shape or link is matched as precisely as possible.

ContainerNode Improvements

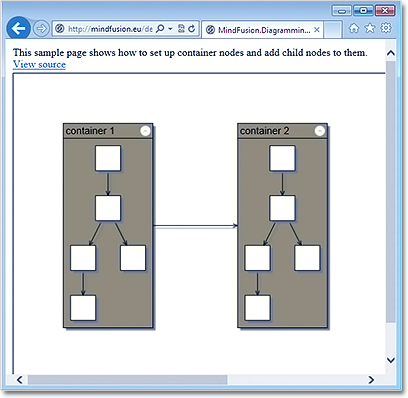
  • child nodes are now drawn by their containers; when the containers overlap, the children of the lower container do not appear in front of the children of the upper container anymore;
  • you can use the ClipChildren property to specify whether child items are clipped to the container’s boundaries;
  • the ZIndex property does not get automatically updated when new nodes are dropped into a container.
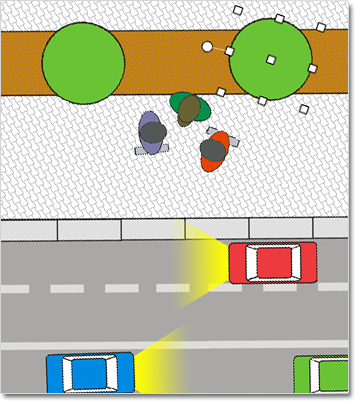
Container Nodes

Container Nodes

PdfExporter Improvements

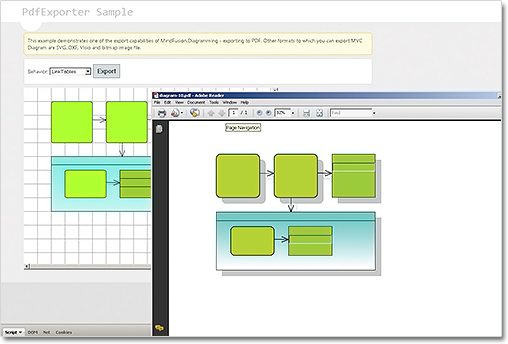
  • Improved handling of clip regions in custom drawing code
  • PDF shadings now include all colors from a ColorBlend
  • PdfExporter is now thread-safe
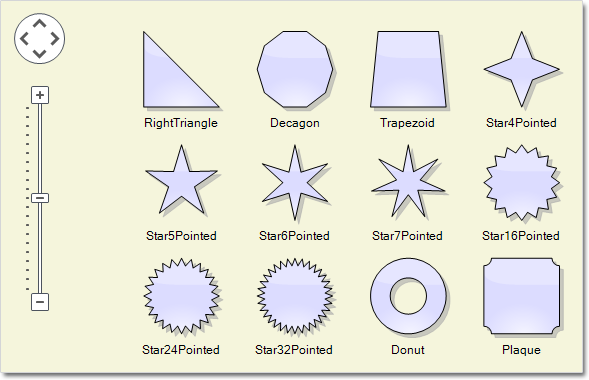
The PdfExporter

The PdfExporter

Miscellaneous

More information about the new release is posted at the forum. You can download the trial version of the component from the link below:

Download MindFusion.Diagramming for ASP.NET MVC 1.6

Technical support

Technical support is available at the Diagramming for ASP.NET MVC forum, the help desk, or per e-mail at support@mindfusion.eu. Excellent customer support is one of our top priorities and we try to provide competent and detailed answers to all your questions within hours of receiving them.

About Diagramming for ASP.NET MVC Control: It is a multi-purpose diagramming tool that consists of two parts: a .NET class library running on the server and a client side control implemented in JavaScript. The server side .NET library implements a flow-diagramming object model that lets you define structures such as trees, flowcharts and graphs. Every element in the diagram is easily accessible and the whole diagram is rendered as part of an HTML page by just calling the DiagramView extension method.

On the client the diagram is rendered by a DiagramView JavaScript control that draws its content on an HTML Canvas. The user is able to add nodes and links simply by drawing them with the mouse. There is also a NodeListView control, which lets users create new nodes via drag and drop.

MvcDiagram also supports various automatic layout algorithms that will make every diagram easy to understand and nice to look at. The diagram can also be easily serialized in binary or XML format. Exporting is done in a variety of formats including Pdf, Svg, Visio and more. You can read details about the components at the MvcDiagram features page.

Diagramming for WinForms 6.0.4

MindFusion has released a new version of its popular diagramming component for WinForms. Most of the new features are requested by the users – here is a list:

Import of OpenOffice Draw Files

The new DrawImporter class can import *.odg files, created by the OpenOffice Draw vector graphics editor. The importer requires a reference to the MindFusion.Diagramming.Import.Draw.dll assembly. The DrawImporter supports shapes from the General and Flowchart shape palettes in Draw. At your disposal are a variety of Import method overloads that can be used to import the OpenOffice drawing into a DiagramDocument whose pages correspond to the Draw pages, or into a single Diagram whose content is merged from all imported pages.

Import from OpenOffice Draw files is now supported.

Import from OpenOffice Draw files is now supported.

Miscellaneous

Rotation of a node.

Rotation of a node.

A trial version of the component is available from this link:

Diagramming for WinForms 6.0.4

If you have questions or run into problems using the component you can use the Diagramming for WinForms forum, the help desk or write us at support@mindfusion.eu. Our support team will be pleased to help you.

About MindFusion.Diagramming for WinForms: A programming component that provides any WinForms application with a full set of features for creating and customizing all types of diagrams, flowcharts, schemes, hierarchies, trees, graphs etc. The control provides numerous ways to save and load a diagram, six auxiliary controls and more than 10 automatic graph layout algorithms. Diagram elements include scrollable tables, container nodes, multi-segment arrows, custom diagram item types and many more. Further details here.

Diagramming for WinForms is a royalty-free component, clients get 12 month upgrade subscription when buying a license. The source code is also available for purchase. Visit the buy page for a list with the current license prices.

Diagramming for ASP.NET MVC 1.5

A new version of MindFusion diagramming tool for ASP.NET MVC is released. Here is a list of the new features:

Node Effects

You can now apply two visual effects – the GlassEffect and AeroEffect to nodes. To apply an effect,
you must create an instance of the GlassEffect or AeroEffect classes, adjust its properties and add the instance to the Effects collection of the node. You should use Diagram.NodeEffects if you want to apply the effects on all nodes. Effects can be applied at any time and this will immediately affect the
appearance of the diagram. You can apply more than one effect of the same type as well effects of
different types simultaneously.

Sample themes for your diagrams.

Sample themes for your diagrams.

Radial Gradients

You can set gradient brushes for nodes with the setBrush method. If your gradient blends only two
colors, you can use the color1 and color2 fields to specify them. For more colors you have colorStops.

Multiple Labels per Link

Use the LinkLabel class to set multiple captions on a single DiagramLink object. Link labels provide a set of properties that allow full customization of their appearance and position. Labels support automatic arrangement to avoid overlapping nodes and other labels – set LinkLabel.AutoArrange to true.

A network chart.

A network chart.

New Events

As well other new methods and features. Read the full list at the news page on the MvcDiagram forum
section.
The trial version of the new release is available for download from the following link:

Download MindFusion.Diagramming for ASP.NET MVC 1.4

Technical Support

If you have any questions about Diagramming for ASP.NET MVC you can post them at the forum, the
help desk, or per e-mail at support@mindfusion.eu. Excellent customer support is one of MindFusion top
priorities and we try to provide competent and detailed answers to your questions within hours of
receiving them.

About Diagramming for ASP.NET MVC Component: It is a multi-purpose diagramming tool that consists of
two parts: a .NET class library running on the server and a client side control implemented in JavaScript.

The server side .NET library implements a flow-diagramming object model that lets you define structures
such as trees, flowcharts and graphs. Every element in the diagram is easily accessible and the whole
diagram is rendered as part of an HTML page by just calling the DiagramView extension method.

On the client the diagram is rendered by a DiagramView JavaScript control that draws its content on an
HTML Canvas. The user is able to add nodes and links simply by drawing them with the mouse. There is
also a NodeListView control, which lets users create new nodes via drag and drop.

MvcDiagram also supports various automatic layout algorithms that will make every diagram easy to
understand and beautiful to look at. The diagram can also be easily serialized in binary or XML format.
Exporting is done in a variety of formats including Pdf, Svg, Visio and more. You can read details about
the components at the MvcDiagram features page.

Create a block diagram editor in JavaScript

In this example, we will create a block diagram editor using MindFusion.Diagramming for JavaScript.

First, let’s add two HTML canvas elements to a page, one for the Diagram control and one for a NodeListView control that will serve as a tool palette:

<!-- The Diagram component is bound to the canvas element below -->

<div style="width:800px; height:600px; overflow:auto; border: 1px solid;">
  <canvas id="diagram" width="2100" height="2100">
    This page requires a browser that supports HTML 5 Canvas element.
  </canvas>
</div>


<!-- NodeListView control -->

<div style="width:130px; height:600px; overflow:none; border: 1px solid rgb(0, 0, 0);">
  <canvas id="nodeList" width="130" height="600"></canvas>
</div>

Next, add references to the necessary script files:

<script src="MicrosoftAjax.js" type="text/javascript"></script>
<script src="MindFusion.Diagramming.js" type="text/javascript"></script>
<script src="BlockDiagEdit.js" type="text/javascript"></script>

In the load handler in the script file, setup the diagram properties and populate the node list with prototype containers and shape nodes, that will represent respectively systems and modules in our block diagrams:

Sys.Application.add_load(function (sender, args)
{
	// create a Diagram component that wraps the "diagram" canvas
	diagram = $create(Diagram, null, null, null, $get("diagram"));
	diagram.addEventListener(Events.nodeCreated, onNodeCreated);
	diagram.addEventListener(Events.linkCreated, onLinkCreated);
	diagram.setLinkHeadShapeSize(3);
	diagram.setLinkHeadShape("Alternative");
	diagram.setAllowInplaceEdit(true);

	// create a NodeListView component that wraps the "nodeList" canvas
	var nodeList = $create(MindFusion.Diagramming.NodeListView,
        null, null, null, $get("nodeList"));
	nodeList.setIconSize(new Size(48, 48));
	nodeList.setDefaultNodeSize(new Size(24, 24));

	var colors = [
		"#FF5555",
		"#55FF55",
		"#5555FF",
		"#FFFFFF"
	];

	// add container to the NodeListView to represent "system" blocks
	for (var i = 0; i < 4; ++i)
	{
		var node = new ContainerNode(diagram);
		node.setBrush(colors[i]);
		nodeList.addNode(node, "System " + (i + 1));
	}

	// add container to the NodeListView to represent "module" blocks
	for (var i = 0; i < 4; ++i)
	{
		var node = new MindFusion.Diagramming.ShapeNode(diagram);
		node.setShape("Rectangle");
		node.setBrush(colors[i]);
		nodeList.addNode(node, "Module " + (i + 1));
	}
});

Handle the nodeCreated event to make containers larger, and start inplace edit operation to let users enter text immediately after dropping a node:

function onNodeCreated(sender, args)
{
	var node = args.getNode();
	if (ContainerNode.isInstanceOfType(node))
	{
		// make containers larger
		var bounds = node.getBounds().clone();
		bounds.width = 100;
		bounds.height = 75;
		node.setBounds(bounds);
	}

	// let user enter text immediately
	diagram.beginEdit(node);
}

When there aren’t anchor points defined, the diagram control snaps link points to nearest point of nodes borders. Let’s automatically align points when links are created to make them straight horizontal or vertical lines if they are already close to being such. Otherwise leave points unchanged to let users draw diagonal lines too:

function onLinkCreated(sender, args)
{
	var link = args.getLink();
	var start = link.getStartPoint();
	var end = link.getEndPoint();

	// make link horizontal if close to being one
	if (Math.abs(start.x - end.x) > 10 && Math.abs(start.y - end.y) < 4)
	{
		end.y = start.y;
		link.setEndPoint(end);
	}

	// make link vertical if close to being one
	if (Math.abs(start.y - end.y) > 10 && Math.abs(start.x - end.x) < 4)
	{
		end.x = start.x;
		link.setEndPoint(end);
	}
}

Here’s the kind of block diagrams and flowcharts you can now draw:
Block diagram

The complete example can be downloaded from this link:
https://mindfusion.eu/_samples/BlockDiagEdit.zip

Enjoy!

Diagramming for WinRT Beta Version

We have almost finished the initial release of MindFusion.Diagramming component for WinRT. The release
implements most of the API of the MindFusion.Diagramming for Silvelright component. You can read the online reference here:

Diagramming for Silvelright Online Reference

MindFusion.Diagramming for WinRT

MindFusion.Diagramming for WinRT

The Magnifier and Overview controls as well the printing functionality are currently not supported.
Single-touch events are equivalent to mouse input in the Silverlight control. Additionally, the WinRT library implements the following multi-touch gestures:

  • dragging two fingers in same direction over a node translates it
  • dragging two fingers in opposite directions over a node scales and/or rotates it
  • dragging two fingers over an unoccupied point pans the diagram

If the diagram is inside a ScrollViewer, multi-touch gestures are handled only if the ManipulationMode property is set to None; otherwise they are intercepted by the parent ScrollViewer control.

When adding references to the MindFusion.* assemblies, their accompanying resource folders (MindFusion.Diagramming and MindFusion.Diagramming.Controls) must be in the same location as the dll files. If copying or moving the diagramming.dll assemblies, you must also copy these folders in order for Visual Studio to discover the necessary resources.

You are welcome to download and test the beta version:

MindFusion.Diagramming for WinRT Beta Version

Your feedback is highly appreciated. You can write your reviews at the forum or at support@mindfusion.eu.
Thank you.