This post demonstrates MindFusion.Diagramming API functionality that let you traverse connected diagram elements (following incident edges and adjacent nodes in graph-theory terminology). A diagram is treated as directed graph, where each node exposes incomingLinks and outgoingLinks collection properties, and respectively each link exposes origin and destination node properties. Thus the classic breadth-first search algorithm can be implemented like this for a diagram, with the callback parameter being invoked for each node, also reporting visit order and distance from initial node (as in length of shortest path in the graph):
Tag Archives: javascript
Using MindFusion ToolStrip Library in JavaScript
In this blog post we are going to look at the way you can build the ToolStrip that you see at the image below. We use the ToolStrip control, which is part of MindFusion Pack for JavaScript. Here is the final result:

We will go through the process of creating the toolstrip step-by-step, from scratch, clarifying the most important details.
You can run the sample online at https://mindfusion.eu/samples/javascript/grid/TrainSchedule.html
Custom Grid Drawing in Charting for JavaScript
In this blog post we will look in short at the steps to build this JavaScript area chart with custom grid:

The line chart uses DateTimeSeries for the data and a standard GridType for the major grid lines. The auxiliary grid lines among them are made with custom drawing: we will discuss in details the code for that.
The sample uses MindFusion Charting library for JavaScript, which also supports TypeScript.
You can see the sample online at https://mindfusion.eu/samples/javascript/chart/CustomGrid/DateTimeSeries.html
Running JavaScript Diagram Applications with Electron.js
In this blog post we will demonstrate how to setup a Unix/Linux system to run a sample JavaScript diagram application under Electron.js. We use a Raspberry Pi computer which runs Raspberry Pi OS – the Debian-based OS optimized for the Raspberry Pi hardware.
Here is how our test application looks like:

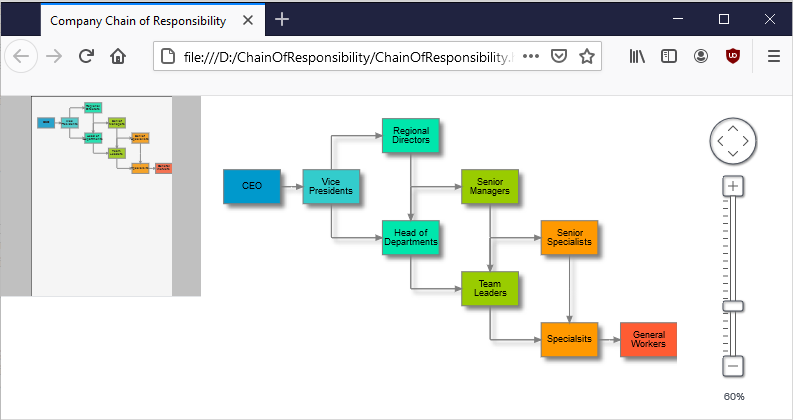
Chain Of Responsibility Diagram
We will build a diagram where we will arrange the nodes in a hierarchical manner to visualize the chain of responsibility in a company. We use the JavaScript Diagramming library, the TreeLayout and custom AnchorPattern definitions for nodes. Here is the final result: