In this post we will show how to use the JavaScript diagram library to generate a class inheritance diagram. The complete example is available here:
and a live version here:
http://mindfusion.eu/demos/jsdiagram/Inheritance.html
Let’s start by creating shortcuts to some classes from the diagram model:
var Diagram = MindFusion.Diagramming.Diagram;

var DiagramItem = MindFusion.Diagramming.DiagramItem;
var DiagramLink = MindFusion.Diagramming.DiagramLink;
var DiagramNode = MindFusion.Diagramming.DiagramNode;
var ShapeNode = MindFusion.Diagramming.ShapeNode;
var TableNode = MindFusion.Diagramming.TableNode;
var ContainerNode = MindFusion.Diagramming.ContainerNode;
var FreeFormNode = MindFusion.Diagramming.FreeFormNode;
var SvgNode = MindFusion.Diagramming.SvgNode;

var ScrollBar = MindFusion.Diagramming.ScrollBar;
var Rect = MindFusion.Drawing.Rect;
var Font = MindFusion.Drawing.Font;
var TreeLayout = MindFusion.Graphs.TreeLayout;
Next, create a function that takes a Diagram instance and a list of class names as parameters. It will create a TableNode for each class. Each property of the class prototype is listed in a TableNode cell. If the getBaseType function detects a class inherits another one from the list, we’ll create a link between their nodes. Finally, the diagram is arranged using the TreeLayout algorithm.
function createClassDiagram(diagram, classes)
{
    var classConstructors = [];

    // create a table node for each class
    for (var i = 0; i < classes.length; i++)
    {
        var className = classes[i];
        var node = diagram.getFactory().createTableNode(20, 20, 42, 42);
        node.redimTable(1, 0);
        node.setText(className);
        node.setBrush("white");
        node.setCaptionBackBrush("lightgray");
        node.setCaptionFont(
            new Font("sans-serif", 3, true /*bold*/, true /*italic*/));
        node.setScrollable(true);

        var ctor = eval(className);
        for (var property in ctor.prototype)
        {
            node.addRow();
            node.getCell(0, node.rows.length - 1).setText(property);
        }
        classConstructors.push(ctor);
        ctor.classNode = node;
    }

    // create a diagram link for each prototype inheritance
    classConstructors.forEach(function(ctor)
    {
        var base = getBaseType(ctor);
        if (base && base.classNode)
        {
            var link = diagram.factory.createDiagramLink(
                base.classNode,
                ctor.classNode);
            link.setHeadShape(null);
            link.setBaseShape("Triangle");
            link.setBaseShapeSize(3);
        }
    });

    // arrange as a tree
    var treeLayout = new TreeLayout();
    treeLayout.linkType = MindFusion.Graphs.TreeLayoutLinkType.Cascading;
    diagram.arrange(treeLayout);
}
The getBaseType implementation checks if a class was registered as a base for the argument using MindFusion.registerClass method or the common prototype inheritance pattern.
function getBaseType(ctor)
{
    // if class registered using MindFusion.registerClass
    if (ctor.__baseType)
        return ctor.__baseType;

    // if  prototypical inheritance with Child.prototype = new Parent()
    if (ctor.prototype && ctor.prototype.constructor != ctor)
        return ctor.prototype.constructor;

    return null;
}
The ready handler creates a Diagram instance binding it to a #diagram canvas element. It then calls createClassDiagram with a list of DiagramItem -derived classes as argument:
$(document).ready(function ()
{
    TableNode.prototype.useScrollBars = true;
    ScrollBar.prototype.background = "Lavender";
    ScrollBar.prototype.foreground = "DarkGray";

    // create a Diagram component that wraps the "diagram" canvas
    var diagram = Diagram.create($("#diagram")[0]);

    createClassDiagram(diagram,
    [
        "DiagramItem",
        "DiagramLink",
        "DiagramNode",
        "ShapeNode",
        "TableNode",
        "ContainerNode",
        "FreeFormNode",
        "SvgNode"
    ]);
});
If you run the sample now, you should see this nice visualization of MindFusion classes 🙂
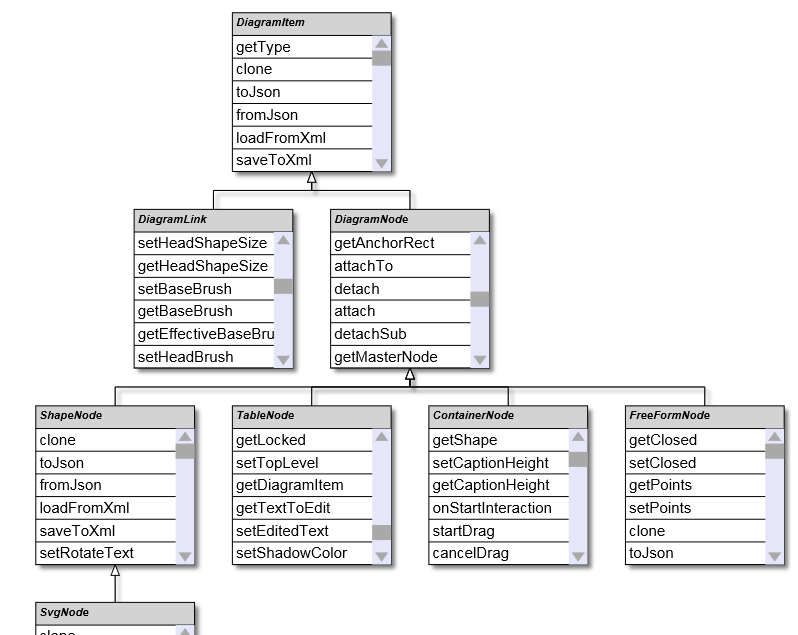
For more information on MindFusion JavaScript diagram library, see its help reference and overview page.
Enjoy!