MindFusion.Spreadsheet for WinForms 1.0.1

MindFusion has released version 1.0.1 of its spreadsheet component. The new release has fixed various bugs and offers improved binary and XML serialization. We have made some major changes to the control and it is not backward compatible.

A spreadsheet created with MindFusion.Spreadsheet for WinForms

A spreadsheet created with MindFusion.Spreadsheet for WinForms

You can download the trial version from the link below:

MindFusion.Spreadsheet for WinForms 1.0.1

If you require technical support, you can post a message at the forum, send us an e-mail at support@mindfusion.eu. or use the help desk. MindFusion takes special effort in providing fast and detailed answers to all inquiries that we receive.

About MindFusion.Spreadsheet for WinForms: An easy-to-use programming component suitable for building all types of spreadsheets fast and easy. The tool supports formulas, tool-tips, cell annotations, cell spanning, scrolling and many more. You can add charts and images as well use the flexible style system to design the perfect spreadsheet. The component supports full undo and redo as well copy and paste from Windows clipboard. You can import spreadsheet data from CSV, XLSX or ODS files and export the final spreadsheet in a number of formats – as images, PDF or CSV files. Various auxiliary forms help you quickly adjust the data and appearance of your spreadsheet. Read more about the features of the component here or check the license prices at the buy page.

Spreadsheet for WinForms is part of MindFusion Pack for WinForms, which offers other useful components that are of great use when you build any type of WinForms application – from a diagramming library to map control to gauges: check them here.

Scheduling for WinForms, V5.5

MindFusion has released a new version of its Scheduling component for WinForms. Here is an overview of the new features:

Visual Studio 2013 Support
The component’s installer can create a toolbox palette in VS2013 and can optionally install VS2013 sample projects.

Improved Support for Non-Gregorian Calendars
The control provides better support for non-Gregorian calendars, such as Hijri. You can display the Persian calendar through the new PersianCulture. In order to specify the calendar to be used by MindFusion.Scheduling, assign a culture that uses this calendar to the Culture property of the Calendar class.

New Holiday Provider
You can use the new AustraliaHolidayProvider (available in the MindFusion.HolidayProviders.dll assembly) to supply the major holidays in Australia for a specific time interval.

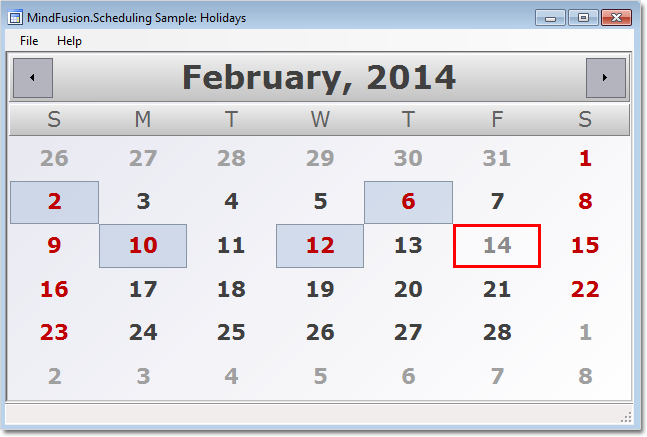
A sample calendar with holidays.

A sample calendar with holidays.

The trial version of the control is available from the link below:

Download MindFusion.Scheduling for WinForms 5.5

If you have questions about the component, please use the support e-mail or the help desk. MindFusion takes special efforts in providing fast and competent answers to all support inquiries we receive.

About MindFusion.Scheduling for WinForms: MindFusion.Scheduling for WinForms is a programming component that adds to your .NET application powerful features for creating and customizing any type of schedule, calendar, time table, resource table and many more. The tool supports six data views, input/output from/to a variety of data sources and rich user interaction model. Scheduling for WinForms offers various auxiliary forms for creating and editing appointments, tasks and events. A theme editor for creating custom themes is also available. The control features a rich variety of predefined themes and various item effects.

You can read more about Scheduling for WinForms at its features page. Visit the gallery page to see screenshots of various calendars and schedules created with the tool. For more information about licenses and prices go to the buy page.

MindFusion.Spreadsheet for WinForms Beta Version

MindFusion.Spreadsheet is a spreadsheet component that can be used to create, open, manage, and export spreadsheet documents in many different formats without requiring Microsoft Excel. It is implemented as a .NET control and can be easily integrated into any application targeting the Microsoft .NET platform.

MindFusion.Spreadsheet supports:

  • Importing documents from CSV, XLSX, ODS
  • Export to PDF,CSV,image
  • Numerous chart types
  • Customizable cell appearance
  • Merged cells
  • Conditional formatting
  • Data validation
  • Images
  • Cell annotations
  • Previewing and printing
  • Undo and redo
  • Auxiliary forms
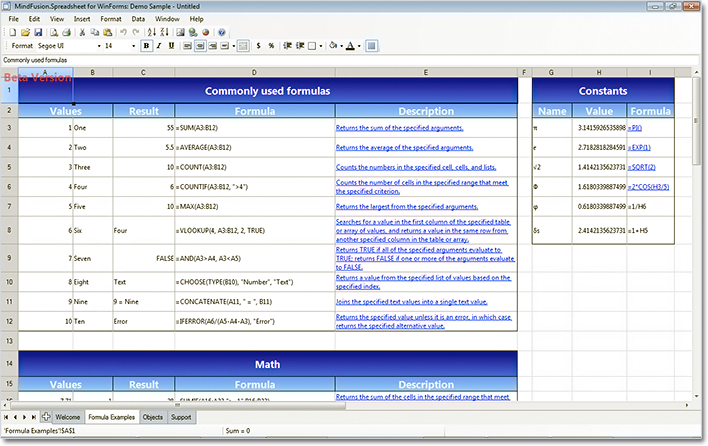
MindFusion.Spreadsheet lets you use an impressive range of calculation formulas.

MindFusion.Spreadsheet lets you use an impressive range of calculation formulas.

MindFusion.Spreadsheet provides intuitive user-interaction model for creating or editing spreadsheet documents. Its programmatic interface is powerful and simple to use. The control has been tested with the most popular .NET development environments and programming languages.

The beta version of the component is available for download from this link:

Download MindFusion.Spreadsheet for WinForms Beta Version

You can learn more about the features of the component here. Take a look at the gallery, which illustrates some of the capabilities of the control. Online documentation is also available at this link.

For technical support, please write at the forum or use email support@mindfusion.eu. You can also use the help desk.

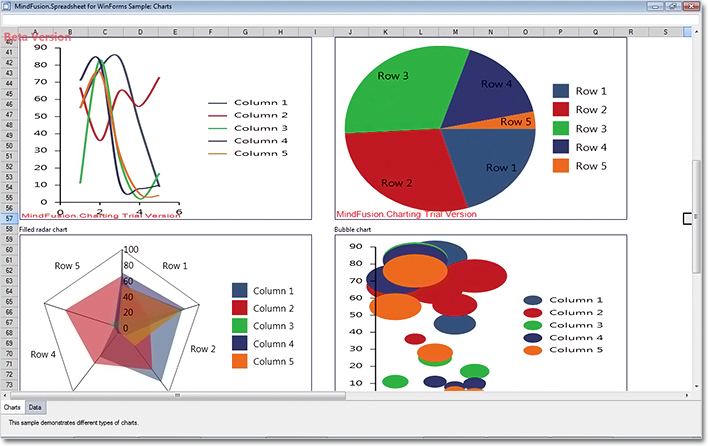
Numerous chart types are available.

Numerous chart types are available.

MindFusion.WinForms Pack, 2013.R2

MindFusion has released a new version of its pack for WinForms. Here is an overview of the new features:

chartMindFusion.Charting

Pie chart interactions

You can now resize every 2D or 3D pie chart by dragging the border between each two adjacent pieces with the mouse. The HitTestAngleOffset property lets you specify the deviation, in degrees, at which a click around the pieces border would still be considered a click on the border.

Mouse dragging in a pie chart.

Mouse dragging in a pie chart.

Support for undefined data values

You can add null (undefined) data values to all charts. The HandleEmptyValue property and the HandleEmptyValue enumeration specify the various ways null values can be handled.

ToolTips

You can now show tooltips for all chart types. In Area charts, tooltips can be displayed for every section between each two adjacent points.

Themes

Chart themes are now represented as XML files and we provide you with an initial set of 8. You can use the SaveTheme and LoadTheme methods to save/load a theme. There is also a theme editor control that lets you create, save and preview themes fast and easy.

Major/minor axis ticks

You can divide all chart axes more precisely using the new MajorTickLength and MinorTickLength properties. When their value is greater than zero, ticks are drawn not only at the axis intervals but also among them. You can customize the number of minor ticks with the MinorTicksPerInterval property.

Miscellaneous

  • Hit testing has been imrpoved in 3D cylinders and area charts
  • custom number formatting has been added to all numeric labels
  • several API changes were introduced

diagram16x16MindFusion.Diagramming

Support for Mono

You can use MindFusion.Diagramming component under the Mono runtime for OSX or Linux. A single version of the mindfusion.* assemblies can be referenced by both Mono and Microsoft .NET applications. The control detects what runtime has loaded it, and provides alternative implementations for features that are currently missing from Mono.

Custom measure units

The type of the MeasureUnit property has been changed from GraphicsUnit enum to MeasureUnit class. This class lets you define custom units by specifying their dots-per inch resolution, a string name, and number of standard divisions for display in the Ruler control. There are two new predefined units available out of the box: Centimeter and WpfPoint.

Shape control points

You can parameterize Shape formulas by associating control points with Shape objects. Each control point is passed to the shape script as a named variable. You can also specify the default, min and max coordinates for each parameter via the ShapeControlPoint constructor, and whether to treat its values as percents or fixed offset.

ContainerNode improvements

  • Child nodes are now drawn by their containers; when containers overlap, the children of a lower container cannot appear in front of the upper container anymore;
  • The ClipChildren property specifies whether to clip child items to container’s boundaries;
  • The ZIndex property no longer changes automatically when dropping nodes into a container;
Container nodes in Diagramming for WinForms

Container nodes in Diagramming for WinForms

Import OpenOffice Draw files

The DrawImporter class can import .odg files, created by the OpenOffice Draw vector graphics editor. In order to use it, you must add a reference to the MindFusion.Diagramming.Import.Draw.dll assembly. Various overloads of the Import method can be used to import the OpenOffice drawing into a DiagramDocument whose pages correspond to the Draw pages, or into a single Diagram whose content is merged from all imported pages.

PdfExporter improvements

  • Improved handling of clip regions in custom drawing code;
  • PdfExporter now honors the target Rectangle property of linear gradients;
  • PDF shadings now include all colors from a ColorBlend;

New events

  • The SetSelfLoopShape event is raised when a link becomes a self-loop, giving you a chance to set a custom shape for the link;
  • QueryAlignTarget event is raised to determine if a node should be used as alignment guide target when AutoAlignNodes is enabled;

Report-16x16 MindFusion.Reporting

Several bug fixes and improvements.

Calendar-16x16 MindFusion.Scheduling

Several new members have been added:

  • Calendar.FilterItem event
  • Calendar.SetViewport method
  • ResourceViewSettings.EnableCollisions property

You can read more details about the new features of each component at the forum. Use the link below to download the trial version of the control:

Download MindFusion.WinForms Pack 2013.R2

If you run into problems with any of the components, please let us know. We shall be glad to assist you. MindFusion is proud with its excellent technical support – the majority of the questions are answered within hours of receiving them.

About MindFusion.WinForms Pack: A set of five WinForms programming components that provide your application with a rich choice of diagramming, charting, scheduling, mapping, reporting and gauge features. The tools are very easy to implement and use. They boast intuitive API and various step-by-step tutorials to get you started. Both online and offline documentation is available. A sample browser presents you with all the samples for each control to let you easily navigate to what you need. You can check some of the features of each component right now if you look at the online demos:

Visit the features – page of the components for more information about their capabilities:

You can check the prices and licensing scheme here. All components are royalty-free.

Scatter Line Chart in WinForms with a Custom Legend

In this post we show you how to build a multi-series scatter chart with a legend and a separator. We use MindFusion.Charting tool for WinForms.

The Data

The properties that specify data in the control are XData and YData. We add three series to each one for the three series that we want to show. Before that, we clear the arrays, to make sure no previously added data shows on the chart:

 lineChart1.XData.Clear();
 lineChart1.XData.Add(new List{3,4,5,6,7,8,9});
 lineChart1.XData.Add(new List{1,2,3,4,5,6,7,8});
 lineChart1.XData.Add(new List{1,2,3,4,5,6,7,8,9,10});

 lineChart1.YData.Clear();
 lineChart1.YData.Add(new List{92, 112, 241, 195, 201, 188, 212});
 lineChart1.YData.Add(new List{512, 480, 321, 491, 460, 320, 298, 241});
 lineChart1.YData.Add(new List { 340, 302, 322, 401, 487, 503, 421, 460, 513, 490 });

Chart Series

We want to show line series with scatters – since this is the default LineType, we don’t have to set anything. In order to customize our series, we add new pens to the ChartPens property. The colors of the scatters are customized with ShapePens and ShapeBrushes. We make the chart pens a bit thicker – 3 pixels.

 lineChart1.ShapeBrushes.Add(new MindFusion.Drawing.SolidBrush(Color.FromArgb(175, 251, 175)));
 lineChart1.ShapeBrushes.Add(new MindFusion.Drawing.SolidBrush(Color.FromArgb(176, 224, 230)));
 lineChart1.ShapeBrushes.Add(new MindFusion.Drawing.SolidBrush(Color.FromArgb(216, 191, 216)));

 lineChart1.ChartPens.Add(new MindFusion.Drawing.Pen(Color.FromArgb(144,238,144), 3.0f));
 lineChart1.ChartPens.Add(new MindFusion.Drawing.Pen(Color.FromArgb(70, 130, 180), 3.0f));
 lineChart1.ChartPens.Add(new MindFusion.Drawing.Pen(Color.FromArgb(186, 85, 211), 3.0f));

 lineChart1.ShapePens.Add(new MindFusion.Drawing.Pen(Color.FromArgb(144, 238, 144)));
 lineChart1.ShapePens.Add(new MindFusion.Drawing.Pen(Color.FromArgb(70, 130, 180)));
 lineChart1.ShapePens.Add(new MindFusion.Drawing.Pen(Color.FromArgb(186, 85, 211)));

Separator Line

We would like to show a separator line that indicates the average value from all chart data. We add a SummaryValue to the SummaryValues collection. Then we customize the summary line by specifying its pen, scatter type and scatter size. We also set the pen and the brush for the scatters. Here is how we do it:

  lineChart1.SummaryPens.Add(new MindFusion.Drawing.Pen(Color.FromArgb(255,69,0), 4.0f);
  lineChart1.SummaryShapeBrushes.Add(new MindFusion.Drawing.SolidBrush(Color.FromArgb(255,228,225))); 
  lineChart1.SummaryShapePens.Add(new MindFusion.Drawing.Pen(Color.FromArgb(255,69,0));
  lineChart1.SummaryShapes.Add(MindFusion.Charting.Shape.Rhombus);
  lineChart1.SummaryShapeSizes.Add(15.0);
  lineChart1.SummaryValues.Add(MindFusion.Charting.Summary.Average);   

Axes Labels

We want to show custom text at the X-axis, so we set XAxisSettings.LabelType to AxisLabelType.CustomText. We use the XLabels property to add the labels. We also add a title with the XAxisSettings.TitleLabel property.

For the Y-axis we want to show the auto scale – we set it with YAxisSettings.MaxValue, YAxisSettings.MinValue and YAxisSettings.AxisDelta. We show ticks on both axes with the MajorTickLength property.

 lineChart1.YAxisSettings.AxisDelta = 50;
 lineChart1.YAxisSettings.MajorTickLength = 2F;
 lineChart1.YAxisSettings.MaxValue = 600;
 lineChart1.YAxisSettings.MinValue = 0;

 lineChart1.XAxisSettings.AxisDelta = 1;
 lineChart1.XAxisSettings.LabelType = MindFusion.Charting.AxisLabelType.CustomText;
 lineChart1.XAxisSettings.MajorTickLength = 5F;
 lineChart1.XAxisSettings.MaxValue = 11;
 lineChart1.XAxisSettings.MinValue = 0;
 lineChart1.XAxisSettings.TitleLabel = "Year";

The Legend

The labels for the legend are set with the LegendLabels property. The colors are picked automatically from the ChartPens property for each series. We place the legend at the bottom with LegendPosition and increase its offset with LegendOffset. We want the legend in one row, so we set LegendColumns to the count of the labels – 3.

 lineChart1.LegendColumns = 3;
 lineChart1.LegendLabels = new List{"Europe, Asia, North America"};
 lineChart1.LegendOffset = 30f;
 lineChart1.LegendPosition = MindFusion.Charting.Position.Bottom;

Here is a screenshot from the final chart:

Scatter Chart with a Custom Legend

Scatter Chart with a Custom Legend

You can download the sample from this link:

Download Scatter Chart with a Custom Legend Sample

The trial version of MindFusion.Chart for WinForms boasts many different samples, great charting tips and step by step tutorials. You can download it directly from here:

Download MindFusion.Charting for WinForms 3.5 Trial Version

About MindFusion.Charting for WinForms: a professional programming component for WinForms, which lets you create remarkable charts fast and easy. The tool supports all major chart types – line, pie, radar and bar – and numerous variations of them – column, area, bubble, polar, doughnut etc. 3D charts are supported as well.

Charting for WinForms supports a rich user interaction model with features like zoom, hit testing, drill down, mouse dragging and more. You can use delegates to present mathematical functions, undefined values are also acceptable. Values can be data arrays or retrieved through a database.

The appearance of each chart is fully customizable. The control offers strong design-time support with custom collection editors and chart wizards. At your disposal is a set of predefined appearance themes and a theme editor tool. A full list of the features can be read here.