Organization Services Chart with the JavaScript Diagram Library

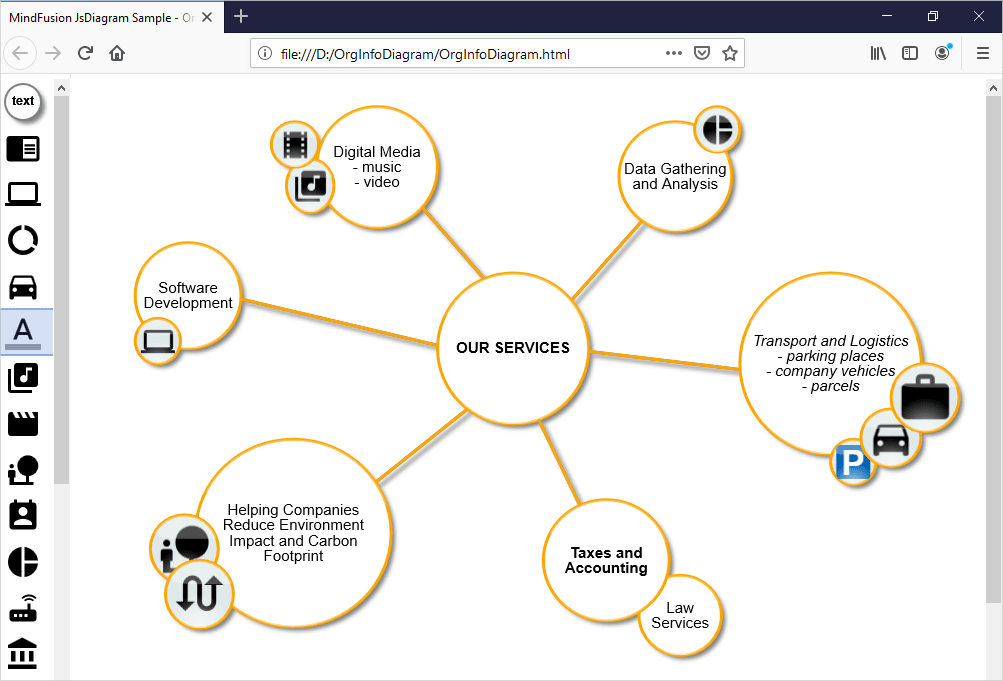
In this blog post we will use MindFusion JavaScript Diagram library to build an application that allows the users to create a diagram with nodes that hold icons and text. We have used this online diagram application to build an infogram for the services portfolio of an imaginary company. However, you can replace the icons and use it as a tool to build diagrams of whatever domain is of interest to you.

In the sample diagram we use SVG images from Google’s material design icons set. You can download them from https://github.com/google/material-design-icons.


Our sample application uses a Diagram and a NodeListView controls – both of them part of JsDiagram.

I. General Settings

We need to add two HTML Canvas elements to the web page where the sample application will be. One is for the NodeListView and the other is for the Diagram

<div style="width: 70px; height: 100%; overflow-y: auto; overflow-x: hidden; position: absolute; top: 5px; left: 0px; right: 0px; bottom: 0px;">
    <canvas id="nodeList" width="200"></canvas>
</div>
...........................
<div style="position: absolute; left: 70px; top: 5px; right: 0px; bottom: 0px; overflow: auto;">
    <canvas id="diagram" width="2100" height="2100">
        This page requires a browser that supports HTML 5 Canvas element.
    </canvas>
</div>

We place the two Canvas elements using CSS next to each other. The NodeListView is in a long and narrow Canvas and next to it is the Diagram Canvas, which has a big size of 211 pixels. It is important that we provide the two Canvases with id-s: we will refer to them later in the JavaScript code using these id-s.

Then we add references to the two JavaScript files that we use from the Diagram library – MindFusion.Diagramming and MindFusion.Common:

<script src="Scripts/MindFusion.Common.js" type="text/javascript"></script>
<script src="Scripts/MindFusion.Diagramming.js" type="text/javascript"></script>
<script src="OrgInfoDiagram.js" type="text/javascript"></script>

The last JavaScript file that we reference is OrgInfoDiagram and there we keep the code for our application.

II. The Diagram

We create the Diagram object by using the reference to the Canvas that will render it:

// create a Diagram component that wraps the "diagram" canvas
diagram = Diagram.create(document.getElementById("diagram"));

Then we use an instance of the Style class to create a style that will determine how newly created –DiagramNode -s are styled:

//styling
var shapeNodeStyle = new Style();
shapeNodeStyle.setBrush({ type: 'SolidBrush', color: '#e0e9e9' });
shapeNodeStyle.setStroke("Orange");
shapeNodeStyle.setFontName("Verdana");
shapeNodeStyle.setFontSize(9);   
shapeNodeStyle.setNodeEffects([new GlassEffect()]);

The Style instance applies GlassEffect on the new nodes and places a thick orange border around them. We also allow users to edit diagram nodes by calling setAllowInplaceEdit .

diagram.setStyle(shapeNodeStyle);
diagram.setAllowInplaceEdit(true);

III. The NodeListView

The NodeListView control can hold both text and image nodes. We create it the same way we created the Diagram : by using the id of its Canvas element:

// create a NodeListView component that wraps the "nodeList" canvas
var nodeList = MindFusion.Diagramming.NodeListView.create(document.getElementById("nodeList"));
nodeList.setTargetView(document.getElementById("diagram"));
nodeList.setIconSize(new Size(36, 36));
nodeList.setDefaultNodeSize (new Size(18, 18));

It is important that we set the target of the NodeListView – this is the Canvas, where the newly created DiagramNode will be rendered. We also set the size of the icons in the NodeListView and the size that newly created nodes will have. For this we use the setIconSize and setDefaultNodeSize methods respectively.

We create the nodes for the NodeListView in a special method called initNodeList:

function initNodeList(nodeList, diagram)
{
    var node = new ShapeNode(diagram);
    node.setText("text");
    node.setShape("Ellipse");
    node.setPen("Gray");		
    node.setBrush("White");
    node.setBounds(new Rect(0, 0, 48, 48));
    node.setEnableStyledText(true);
    node.setFont(new Font("sans-serif", 12, true));
    node.setStrokeThickness(2);
    nodeList.addNode(node);
    .......................................

The first ShapeNode that we create is a standard text node with the difference that we enable styled text for it: that means the user can enter bold, italic or underline text using the standard HTML tags <b>, <i>, <u>. We specify this with the method setEnableStyledText . We also add the node to the NodeListView that we have provided to the method.

In order to create nodes with SVG images, we need to create instances of the SvgNode class:

// add some nodes to the NodeListView
var svgImages = ["call", "reader", "computer", "data", "car", "text", "music", "movie", "nature", "calendar", "chart", "router",  "account", "alarm", "announcement", "book", "calls", "copyright", "event", "grade", "group_work", "info", "key", "list", "payment", "phone", "shop", "sign", "textsms", "theaters", "work"];
for (var i = 1; i <= svgImages.length; ++i)
{
    node = new MindFusion.Diagramming.SvgNode(new Rect(0, i * 48, 48, 48));
    node.setTransparent(true);
var content = new SvgContent(); content.parse(svgImages[i] + ".svg"); node.setContent(content);
nodeList.addNode(node); }

We have copied the desired icons in the directory of the application and we have listed their names in a list. Then we cycle through all members of the list and create instances of the SvgNode class. We set their background to be transparent and we render the images thanks to the SvgContent class. Finally we also add the newly created SvgNode -s to the node list.

We call the initNodeList method providing the nodeList and diagram instances:

initNodeList(nodeList, diagram);

IV. Events

Though the code so far is enough to provide the desired functionality of our application, we want to customize the newly created diagram nodes and links. This can be achieved through events. We handle two of them onNodeCreated and LinkCreated.

diagram.addEventListener(Events.nodeCreated, onNodeCreated);
diagram.addEventListener(Events.linkCreated, onLinkCreated);

In the NodeCreated event handler we get the ShapeNode that is being created and make its shape to a round one with the setShape method. We assign to it a thick orange border and add some padding to the images – in case it is an SvgNode:

function onNodeCreated(sender, args)
{
    var node = args.getNode();
    node.setTransparent(false);
    node.setShape("Ellipse");
    node.setStroke("orange");
    node.setStrokeThickness(3);
    node.setFont(new Font("sans-serif", 4));
    node.setImagePadding(new Thickness(1.5, 1.5, 1.5, 1.5));
}

The linkCreated event handler applies some styling, but to newly created DiagramLink instances”

function onLinkCreated(sender, e)
{
    var link = e.getLink();
    link.setBaseShape(null);
    link.setHeadShape(null);
    link.setStrokeThickness(3.0);
}

We remove the default base and head shapes of the diagram links and leave the connectors to be just straight lines. We also draw them with a thick orange pen.

And these were the last lines of code that we had to add to make the application complete. You can download the source code, together with all all Diagramming libraries used from this link:

Download Organigram Application in JavaScript Source Code

You can use MindFusion Diagramming for JavaScript forum to post your questions, comments and recommendations about this sample or the Js Diagram library.

About Diagramming for JavaScript: This native JavaScript library provides developers with the ability to create and customize any type of diagram, decision tree, flowchart, class hierarchy, graph, genealogy tree and more. The control offers rich event set, numerous customization options, animations, graph operations, styling and themes. You have more than 100 predefined nodes, table nodes and more than 15 automatic layout algorithms. Learn more about Diagramming for JavaScript at https://mindfusion.eu/javascript-diagram.html.

JavaScript Diagram with Chart Nodes

In this blog post we will create DiagramNode instances that render a chart. The charts get resized according to the size of the node. We will use two MindFusion libraries for JavaScript – Charting and Diagramming. You can run the sample online from this link:

I. Project Setup

We will use a web page that will hold the HTML Canvas element that we need in order to render the diagram:

<div style="width: 100%; height: 100%; overflow: scroll;">
    <canvas id="diagram" width="2100" height="2100" style="background:#f0f0f0;">
        This page requires a browser that supports HTML 5 Canvas element.
    </canvas>
</div>

We give the diagram’s Canavs big width and height and we also provide an id. The id is important because we will need to access the Canvas from code.

We add the scripts that we need in order to use the Charting and Diagramming libraries:

<script src="Scripts/MindFusion.Common.js" type="text/javascript"></script>
<script src="Scripts/MindFusion.Diagramming.js" type="text/javascript"></script>
<script src="Scripts/MindFusion.Charting.js" type="text/javascript"></script>

We add the references at the end of the web page, just before the closing BODY tag. We also need to add a reference to a JavaScript file that will hold the code for our sample. We name it “PieNode.js”.

II. The Diagram

In the code-behind file we create a diagram instance. We use the DOMContentLoaded event to initialize our diagram:

document.addEventListener("DOMContentLoaded", function ()
{
// create a Diagram component that wraps the "diagram" canvas
diagram = MindFusion.Diagramming.Diagram.create(document.getElementById("diagram"));
diagram.setBehavior(MindFusion.Diagramming.Behavior.LinkShapes);
diagram.setLinkHeadShapeSize(2);
diagram.setBounds(new Rect(0, 0, 2000, 2000));

// draw a pie when the user creates a node
diagram.addEventListener(Events.nodeCreated, onNodeCreated);

});

The Behavior enumeration lists various modes of behavior for the diagram. We choose Behavior.LinkShapes, which creates nodes, when the mouse is dragged
over an empty area and connects the nodes if the mouse is dragged from an existing node. We set tbe bounds of the diagram to a big Rect which guarantees that the user can draw nodes anywhere on the visible area. When the user draws towards the edge of the browser, the diagram control expands automatically.

Finally, we add an event handler for the nodeCreated event.

//nodeCreated event handler
function onNodeCreated(sender, args)
{
	var node = args.getNode();
	
	var nBounds = node.getBounds ();
	var topLeftCoord = diagram.docToClient(nBounds.topLeft());
	var bottomRightCoord = diagram.docToClient(nBounds.bottomRight());
	.......................................................
}

At first we get the node that was created. Then we need to get its actual size, for which we use the docToClient method that converts between diagram and browser measure units. We get the two coordinates of the node’s bounding rectangle.

We create then a Canvas, which takes the size of the node’s rectangle:

............................................
.....................................................
var pieChartCanvas = document.createElement('canvas');
pieChartCanvas.width = bottomRightCoord.x - topLeftCoord.x;
pieChartCanvas.height = bottomRightCoord.y - topLeftCoord.y;

We then add this temp canvas to the body of the web page and call a method “createPie” where we draw the pie chart. Once the chart is drawn we get the URL of the image and set is to the node with the setImageLocation method. We remove the Canvas from the tree with the elements because we want to use for the next node.

//create a temporary Canvas for the pie chart
//to draw itself upon
document.body.appendChild(pieChartCanvas);
createPie(pieChartCanvas);
var pieImageLocation = pieChartCanvas.toDataURL();
node.setImageLocation(pieImageLocation);
document.body.removeChild(pieChartCanvas);

III. The Chart

We create a pie chart in the Canvas provided to the createPie method:

//draw a pie chart on the provided canvas
function createPie(pieChartCanvas)
{
	var pieChart = new Controls.PieChart(pieChartCanvas);
	pieChart.startAngle = 45;			
	pieChart.showLegend = false;
	pieChart.title = "Sales";
	pieChart.titleMargin = new Charting.Margins(0, 10, 0, 0);
	pieChart.chartPadding = 3;
...........................

We set some appearance properties to make the chart look the way we want – change the start angle of the pie, add a title and title margin, hide the legend. Then we create a PieSeries which holds the data and the labels of the pie. We assign the PieSeries to the series property of the pie chart:

// create sample data
var values = new Collections.List([20.00, 30.00, 15.00, 40.00]);
pieChart.series = new Charting.PieSeries(
	values,
	new Collections.List(["20", "30", "15", "40"]),
null);

We style the chart with an instance of the PerElementSeriesStyle class, which colors all elements of a Series with the consequtive Brush and stroke from its brushes and strokes collections. Then we adjust the dataLabelsFontSize to match the size of the canvas. We make the labels be drawn with a white brush using the dataLabelsBrush property. Finally we call draw to render the pie.

var brushes = new Collections.List(
		[
			new Drawing.Brush("#0455BF"),
			new Drawing.Brush("#033E8C"),
			new Drawing.Brush("#F24405"),
			new Drawing.Brush("#F21905")
		]);

	var seriesBrushes = new Collections.List();
	seriesBrushes.add(brushes);

	var strokes = new Collections.List(
		[
			new Drawing.Brush("#c0c0c0")
		]);

	var seriesStrokes = new Collections.List();
	seriesStrokes.add(strokes);

	pieChart.plot.seriesStyle = new Charting.PerElementSeriesStyle(seriesBrushes, seriesStrokes);
	pieChart.theme.highlightStroke = new Drawing.Brush("#000063");
	pieChart.theme.dataLabelsFontSize = pieChartCanvas.height/20;
	pieChart.theme.dataLabelsBrush = new Drawing.Brush("#FFFFFF");

	pieChart.draw();

And with that the sample is ready. You can download the source code together with all MindFusion JavaScript libraries used from:

https://mindfusion.eu/samples/javascript/diagram/PieNodes.zip

About Diagramming for JavaScript: This native JavaScript library provides developers with the ability to create and customize any type of diagram, decision tree, flowchart, class hierarchy, graph, genealogy tree and more. The control offers rich event set, numerous customization options, animations, graph operations, styling and themes. You have more than 100 predefined nodes, table nodes and more than 15 automatic layout algorithms. Learn more about Diagramming for JavaScript at https://mindfusion.eu/javascript-diagram.html.

About Charting for JavaScript: MindFusion library for interactive charts and gauges. It supports all common chart types including 3D bar charts. Charts can have a grid, a legend, unlimited number of axes and series. Scroll, zoom and pan are supported out of the box. You can easily create your own chart series by implementing the Series interface.
The gauges library is part of Charting for JavaScript. It supports oval and linear gauge with several types of labels and ticks. Various samples show you how the implement the gauges to create and customize all popular gauge types: car dashboard, clock, thermometer, compass etc. Learn more about Charting and Gauges for JavaScript at https://mindfusion.eu/javascript-chart.html.

The Different Ways to Style a Schedule

In this blog post we will look at the different levels of sty‌ling the elements and items of a schedule made with a MindFusion scheduling library. In our sample we use the Java Scheduling Library, but the API members that we use and the cascading levels of styling a schedule are universal across all MindFusion Scheduling components.

I. Top Level: Theme

At the top level of styling you have themes. The scheduling library has a set of predefined themes: Light, Lila, Silver, Standard, Vista, Windows2013. You apply one of the predefined themes this way:

calendar.setTheme(ThemeType.Vista);

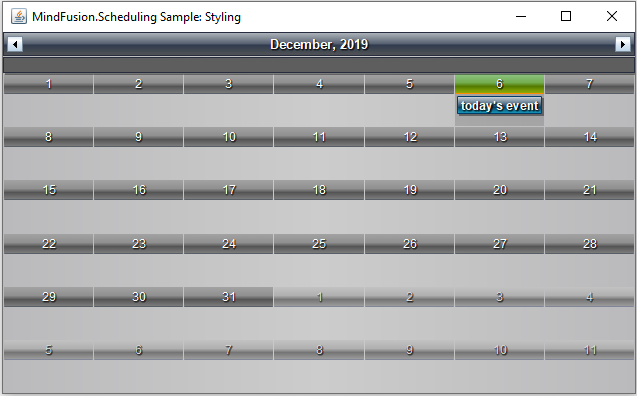
Here is what the calendar looks like styled with the vista theme:

In JavaScript, the themes are defined in CSS styles and you must reference the desired file and set the name of the theme to the calendar instance. In the other libraries, they are built-in and usually are available as members of an enum.

You have the option to create a custom theme, which you can save and apply this way:

calendar.setCustomTheme(new MyTheme());

Another way to apply the custom theme in Java Scheduling is:

calendar.setCustomTheme(new MyTheme());

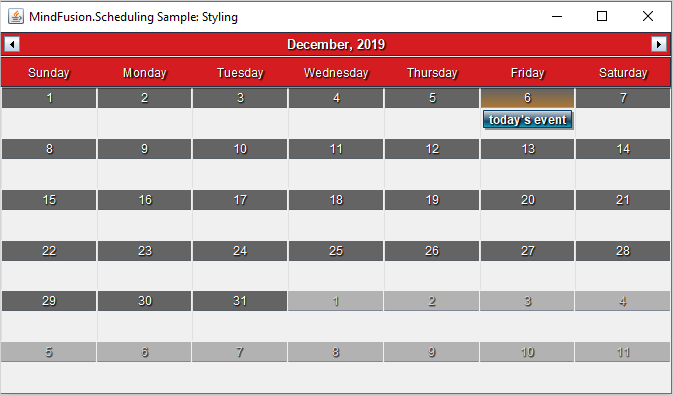
Here is the look of the calendar with the custom theme:

The custom theme has changed some of the colors, widened the header so that the week days could be seen and set some borders on the cells.

Creating a custom Theme requires that you override a strict set of methods. They are the public members of the Theme class. You should override all of them. Among the methods that style the calendar for each view – getMonthRangeSettings getMonthSettings etc. You could override in detail only the method that is responsible for styling the view you would use – if it is only one. For the rest of the methods you could just write:

private void initialize_MyTheme_ListViewSettings()
{
	_listViewSettings = super.createListViewSettings();
}

Every method in the Theme class must be dutifully implemented and all settings set. That comes from the fact that a Theme is the last and topmost styling instrument and it must know how to style any element that might not be explicitly styled down the tree.

The online and offline documentations of the Java Scheduling library come with topics that list in details the styling settings for each of the predefined themes. Our advice is that you get the code of the Theme that looks closest to what you want to have as a structure and modify it.

The sample project that you can download at the bottom of this post implements a custom Theme based on the Vista theme and lists all members in a theme that you must set with all details.

II. View and Item Settings

One level down the tree are the view settings properties. They are available for any view. You can access those settings with the getMonthSettings getMonthRangeSettings etc. methods. Each one of those methods returns the styling settings of a particular view. You should use the one that corresponds to the view you’ve chosen:

//set the view to SingleMonth
calendar.setCurrentView(CalendarView.SingleMonth);
//get the styling settings for SingleMonth view
calendar.getMonthSettings().getDaySettings().setTodayFillColor(Color.green);

You can style the items, regardless of the view used, with the ItemSettings object:

calendar.getItemSettings().setPadding(20);

The *Settings properties define the appearance of items in terms of alignment, spacing, padding, shadow, date format. The coloring of the elements is left to Style instances. Thus, if you want to change the color of items, you will use:

//customize just the items through the itemSettings field
calendar.getItemSettings().setPadding(20);
		
Style itemStyle = new Style();
itemStyle.setBrush(new SolidBrush(Color.white));
itemStyle.setHeaderTextColor(Color.DARK_GRAY);		
itemStyle.setHeaderTextShadowStyle(ShadowStyle.None);
calendar.getItemSettings().setStyle(itemStyle);

This styles all items on the calendar. For styling a particular item, you should use on of the methods listed underneath.

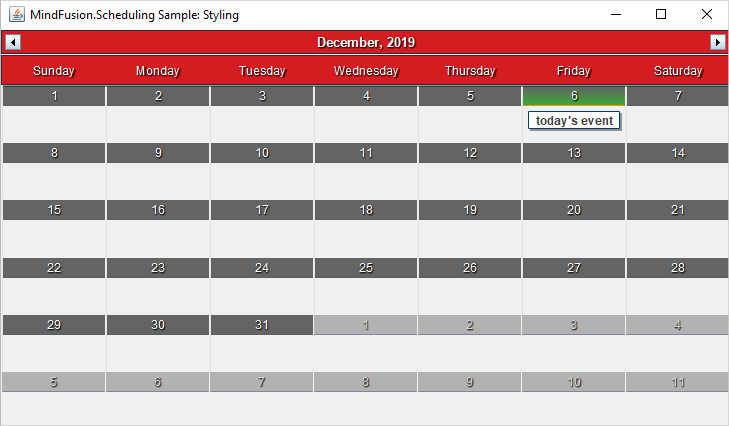
Our calendar now has green header on the current day, the background of events is white and there is a bit of a padding added to the events.

III. Using Events to Style Particular Items

When you want to select items that you want to style based on some distinct characteristics, you can use events. In our sample we handle the itemCreated event, where we check if the start date of an appointment happens to be during the weekend:

// Listen for item creation and for draw events
calendar.addCalendarListener(new CalendarAdapter(){
	//apply custom styling to selected items
	public void itemCreated(ItemEvent e) {
		onItemCreated(e);
	}				
});

The Java Scheduler provides various events, which are accessible through a CalendarListener and CalendarAdapter instances. We handle the itemCreated event this way:

//color in red events that are scheduled to start on weekends
protected void onItemCreated(ItemEvent e) {

	Item item = e.getItem();
	if(item.getStartTime().getDayOfWeek() == DayOfWeek.Saturday || 
		item.getStartTime().getDayOfWeek() == DayOfWeek.Sunday)
		{
			item.getStyle().setBrush(new SolidBrush(new Color(213, 28, 32)));
			item.getStyle().setHeaderTextColor(Colors.White);
			item.getPointedStyle().setBrush(new SolidBrush(new Color(100, 100, 100)));
		}	
}

The ItemEvent class provides the item that was created and you can use the instance to apply any particular styling to the item.

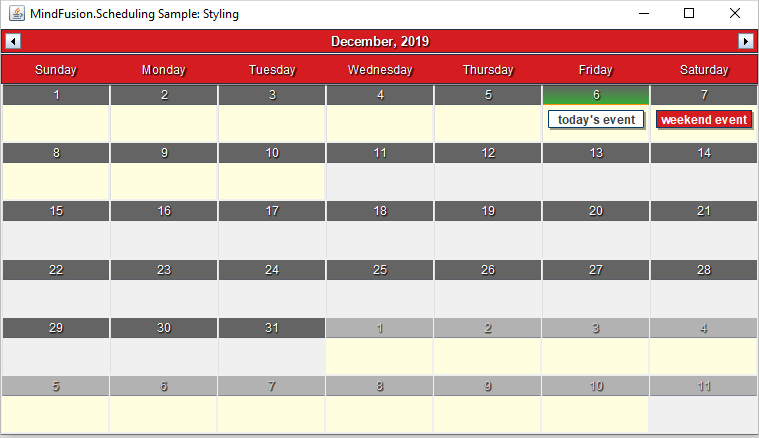
Here is our scheduler, which now colors the items on weekends in red:

In JavaScript, the items have a special field that allows you to assign to them a custom CSS style that you’ve defined. The style will be applied to the particular item only. The field is called ‘cssClass’.

IV. Custom Drawing

When you need to style in a very unique way calendar elements and nothing else helps, you have the option to draw them the way you want. Custom drawing can be made for many parts of the calendar. The available elements are identified as members of the CustomDrawElements enumeration.

You tell the control that you want to use custom drawing this way:

//specify that we will use custom drawing	
calendar.setCustomDraw(EnumSet.of(CustomDrawElements.CellContents));

The custom drawing must be part of the draw method, which is also a member of CalendarListener:

// Listen for item creation and for draw events
calendar.addCalendarListener(new CalendarAdapter(){
				
			
//add custom drawing to CellContents
@Override()
public void draw(CalendarDrawEvent e) {
	onDraw(e);
	} 
			
});

The event handler method looks like this:

//apply custom drawing to selected items
private void onDraw(CalendarDrawEvent e)
{
	if (e.getElement() == CustomDrawElements.CellContents)
	{
		DateTime date = e.getDate();		
		
		//color in light yellow the background of the first 10 days of a month
		if (date.getDay() < 11)
		{
			// Do the custom drawing
			Rectangle2D bounds = new Rectangle2D.Double(
			e.getBounds().getX(), e.getBounds().getY(),
			e.getBounds().getWidth() - 1, e.getBounds().getHeight() - 1);
			new AwtGraphics(e.getGraphics()).fillRectangle(Brushes.LightYellow, bounds);
		}
	}
}

The Calendar’s drawEvent class gives us useful methods to learn more about the item that is being drawn. In our case we want to draw the cell contents, so we check if draw was called for the cell contents, and if yes, we get the bounds of the element. We need the check, because draw is called for all elements that support custom drawing and we need to identify which one is drawn at the moment.

Thanks to the custom drawing, the monthly schedule now has a light yellow background on the first ten days of the month:

With this our review of the methods to style a schedule is finished. You can download the complete source code of the sample together with all MindFusion libraries used from this link:

How to Style a Java Schedule: Download Project Source Code

You can post questions about Mindusion Scheduling components at MindFusion online forums.

About MindFusion Scheduling Components MindFusion Scheduling components are available for a variety of platforms for web, mobile and desktop programming. All of them include a robust feature set that includes 6 calendar views, predefined themes, various events, predefined forms for creating appointments and recurrence. The components are fully interactive, easy to customize and style and are the ideal choice for any application that needs to implement time management features. You can learn more about MindFusion Scheduling tools at https://mindfusion.eu/scheduling-pack.html.

Horizontal Full Bar Chart in JavaScript

We use here MindFusion JavaScript library for Charts and Gauges to build this horizontal stacked bar chart that renders custom tooltips:

Run the sample from this link.

You can download the source code together with the libraries used from the link at the bottom of the post.

I. General Setup

We split our chart in two files – one is the web page that hosts an HTML Canvas element that will render the chart. The other file is a JavaScript code-behind file that contains the code for the chart.

We need to add reference to two JavaScript library files that provide the charting and drawing functionality that we need:

MindFusion.Common.js
MindFusion.Charting.js

We place them in a Scripts folder at the same level as our web page and JavaScript code behind file.

<script type="text/javascript" src="Scripts/MindFusion.Common.js"></script>
<script type="text/javascript" src="Scripts/MindFusion.Charting.js"></script>

We also add a reference to the code-behind file that we call StackedBarChart.js:

<script type="text/javascript" src="StackedBarChart.js"></script>

Now we need to create an HTML Canvas element and we must provide it with an id so we can reference it in our JS code:

<canvas id="barChart" width="600px" height="400px"></canvas>

The size of the Canvas determines the size of the chart.

II. Chart Instance and General Settings

We add some namespace mappings that allow us to reference classes from the Chart library in a more consice manner:

var Charting = MindFusion.Charting;
var Controls = MindFusion.Charting.Controls;
var Collections = MindFusion.Charting.Collections;
var Drawing = MindFusion.Charting.Drawing;
var GridType = MindFusion.Charting.GridType;
var ToolTip = Charting.ToolTip;

Then we create an instance of the BarChart control. We need to get the Dom Element that corresponds to the Canvas that we’ve prepared for the chart:

var chartEl = document.getElementById('barChart');
chartEl.width = chartEl.offsetParent.clientWidth;
chartEl.height = chartEl.offsetParent.clientHeight;
var chart = new Controls.BarChart(chartEl, Charting.BarLayout.Stack);

The BarChart constructor supports a second argument that indicates the type of the bar chart to render.

We set the bar chart to horizontal with the horizontalBars property. We also make the bars thicker than normal – the property for this is barSpacingRatio It measures the thickness of the bars as a percente of the bar width.

chart.horizontalBars = true;
chart.barSpacingRatio = 0.2;

III. The Data Series

We want our chart to render labels as tooltips, inside the bars and also we want custom labels at the Y-axis. The predefined BarSeries class accepts 4 lists with data: one for bar data and three with labels inside the bars, at the top of the bars and at the X-axis. So, it is not an exact match for what we want to do and we need to customize it.

We will create our own custom BarSeries that we will call SeriesWithLabels. We will inherit the BarSeries class and override its constructor and getLabel members to provide the desired data for the desired type of labels.

We override the constructor by creating three new variables, which receive the data for the bars and the labels:

var SeriesWithLabels = function (barValues, innerLabels, yLabels) {
    Charting.BarSeries.apply(this, [barValues, innerLabels, yLabels]);
	
	this.yLabels = yLabels;
	this.innerLabels = innerLabels;
	this.values = barValues;
    
};

SeriesWithLabels.prototype = Object.create(Charting.BarSeries.prototype);

Note that before we do anything else in the new constructor we need to call the apply method of the BarSeries class to transfer the provided data to the base class. We also need to create a prototype of the new series and also define its constructor:

 Object.defineProperty(SeriesWithLabels.prototype, 'constructor', {
   	value: SeriesWithLabels,
   	enumerable: false,
   	writable: true
   });

Next we will override the getLabel method. This is the method that returns the correct label according to the requested label kind and the index of the label. We said we want to support inner labels, tooltips and Y-axis labels. So, we make sure our implementation of getLabel returns exactly those labels:

SeriesWithLabels.prototype.getLabel = function (index, kind) {
    if ((kind & Charting.LabelKinds.YAxisLabel) != 0 && this.yLabels)
        return this.yLabels.items()[index];

    if ((kind & Charting.LabelKinds.InnerLabel) != 0 && this.innerLabels)
        return this.innerLabels.items()[index];
	
	if ((kind & Charting.LabelKinds.ToolTip) != 0)
        return getPercentLabel(index, this);
   
    return "";
};

Getting the correct inner and top label is easy – we just return the label at the requested position. What is more work is building the tooltip. We want our tooltip to calculate the portion of the part in the stacked bar the mouse currently is over, to the entire bar. This means we need to calculate the data of all bar portions, which is a combination of the values at the requested position in all three bar series. We do this calculation in a separate method called getPercentLabel.

Before we get to the getPercentLabel method let’s create 3 instances of our custom SeriesWithLabels class:

var labels = new Collections.List([
	"POSITION", "SALARY", "LOCATION", "COLLEAGUES", "WORKTIME"
]);

// create sample data series
var series1 = new SeriesWithLabels(new Collections.List([123, 212, 220, 115, 0.01]), new Collections.List([123, 212, 220, 115, 0]), labels);
var series2 = new SeriesWithLabels(new Collections.List([53, 132, 42, 105, 80]), new Collections.List([53, 132, 42, 105, 80]), null);
var series3 = new SeriesWithLabels(new Collections.List([224, 56, 138, 180, 320]), new Collections.List([224, 56, 138, 180, 320]), null);

The third argument in the SeriesWithLabels constructor is the lists with labels at the Y-axis. We need just one list with labels and we set it with the first series. The other series take null as their third argument.

We need to create a collection with the series and assign it to the series property of the chart:

var series = new Collections.ObservableCollection(new Array(series1, series2, series3));
chart.series = series;

There is a special property called supportedLabels that is member of Series and tells the chart, what type of labels this Series needs to draw. In our case we need to indicate that the first series renders labels at the Y-axis, the inner labels and tooltips. The other two series render inner labels and tooltips:

series1.supportedLabels = Charting.LabelKinds.YAxisLabel | Charting.LabelKinds.InnerLabel | Charting.LabelKinds.ToolTip;
series2.supportedLabels = Charting.LabelKinds.InnerLabel | Charting.LabelKinds.ToolTip;
series3.supportedLabels = Charting.LabelKinds.InnerLabel | Charting.LabelKinds.ToolTip;

Now let’s get back to the method that calculates the tooltip:

function getPercentLabel(index, series)
{
	var value1 = series1.values.items()[index];
	var value2 = series2.values.items()[index];
	var value3 = series3.values.items()[index];
	
	var theValue = series.values.items()[index];	
	var result = theValue/(value1+value2+value3) * 100;
	
	return Number(result).toFixed(0) + "%";	
};

In it we calculate the sum of all data that is rendered by the stacked bar at the specified index. Then we convert the data to percent and format it to have no numbers after the decimal point. That gives us a little inacurracy sometimes, when the value gets rounded to the next number and the sum of all percents actually is 101. You might want to change the formatting to toFixed(2) if you want to see the exact number rendered.

IV. Axes and Tooltip

By default the X-axis shows a title and both axes render the auto scale for the data of the chart. We need to hide the scale and we also hide the ticks that are rendered at the interval values:

chart.xAxis.title = "";
chart.yAxis.title = "";
chart.showXCoordinates = false;
chart.showYCoordinates = false;
chart.showXTicks = false;
chart.showYTicks = false;

We don’t want our chart to render axes at all, so we will draw them with the color of the chart background. You can also draw them with a transparent brush:

chart.theme.axisStroke = new Drawing.Brush(Drawing.Color.knownColors.White);

The tooltip renders automatically when the user hovers a bar. We can customize it with the properties of the static Tooltip class:

ToolTip.brush = new Drawing.Brush("#fafafa");
ToolTip.pen = new Drawing.Pen("#9caac6");
ToolTip.textBrush = new Drawing.Brush("#5050c0");
ToolTip.horizontalPadding = 6;
ToolTip.verticalPadding = 4;
ToolTip.horizontalOffset = 76;
ToolTip.verticalOffset = 34;
ToolTip.font = new Charting.Drawing.Font("Verdana", 12);

We add some padding to the tooltip text and increase its font size. We also render the tooltip with a little offset that will place it inside the bar, ater the inner label.

V. Styling and Legend

Styling o the charts is done through instances of SeriesStyle derived classes. The instance is assigned to the seriesStyle property of the Chart In our case we want to color each bar in three sections. That means the portion of the bar that corresponds to the same series is colored in the same color for all its members. That kind of styling is supported by the PerSeriesStyle class. It accepts a list with brushes and strokes and paints all elements of the series corresponding to the index of the brush in the list with this brush:

// create bar brushes
var thirdBrush = new Drawing.Brush("#97b5b5");
var secondBrush = new Drawing.Brush("#5a79a5");
var firstBrush = new Drawing.Brush("#003466");

// assign one brush per series
var brushes = new Collections.List([firstBrush, secondBrush, thirdBrush]);
chart.plot.seriesStyle = new Charting.PerSeriesStyle(brushes, brushes);

The theme property is the main property for styling the chart. The Theme class exposes fields for customizing the appearance of all chart elements. We first adjust the font and size of the axis labels – remember we have labels only at the Y-axis:

chart.theme.axisTitleFontSize = 14;
chart.theme.axisLabelsFontSize = 11;
chart.theme.axisTitleFontName = "Verdana";
chart.theme.axisLabelsFontName = "Verdana";
chart.theme.axisLabelsFontSize = 14;
chart.theme.axisStroke = new Drawing.Brush(Drawing.Color.knownColors.White);

The labels inside the bars are called data labels and there are dataLabels*** properties that regulate their appearance:

chart.theme.dataLabelsFontName = "Verdana";
chart.theme.dataLabelsFontSize = 14;
chart.theme.dataLabelsBrush = new Drawing.Brush("#ffffff");

The dataLabelsBrush is also used when the legend labels are rendered. In order to make them visible we need to set a darker background for the legend:

chart.theme.legendBackground = new Drawing.Brush("#cccccc");
chart.theme.legendBorderStroke = new Drawing.Brush("#cecece");

The labels inside the legend are taken from the title property of the Series instances:

series.item(0).title = "CAREER START";
series.item(1).title = "MIDDLE OF CAREER";
series.item(2).title = "CAREER END";

Finally we should not forget to call the draw method that actually renders the chart:

chart.draw();

With this our costimization of the chart is done. You can download the source code of the sample and the MindFusion JavaScript libraries used from this link:

Download the Horizontal Stacked Bar Chart Sample: Source Code and Libraries

About Charting for JavaScript: MindFusion library for interactive charts and gauges. It supports all common chart types including 3D bar charts. Charts can have a grid, a legend, unlimitd number of axes and series. Scroll, zoom and pan are supported out of the box. You can easily create your own chart series by implementing the Series interface.
The gauges library is part of Charting for JavaScript. It supports oval and linear gauge with several types of labels and ticks. Various samples show you how the implement the gauges to create and customize all popular gauge types: car dashboard, clock, thermometer, compass etc. Learn more about Charting and Gauges for JavaScript at https://mindfusion.eu/javascript-chart.html.

Pie Chart with Custom Labels in WinForms

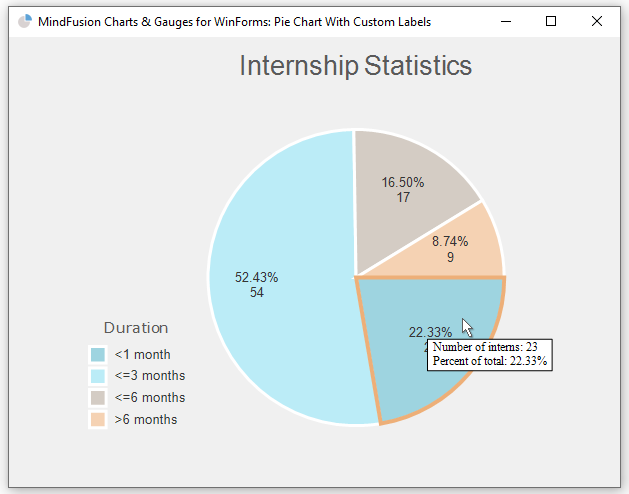
In this tutorial we will build the following pie chart using MindFusion Charts and Gauges for WinForms library:

This is a PieChart with a custom Series class that extends the capabilities of a standard PieSeries We need to create a custom Series class because we want the inner labels to follow a special format and we want the outer labels to be rendered as legend items not near pie pieces.

You can download the source code of the sample together with the MindFusion libraries used from the link at the bottom of the post.

I. General Setup

We create an empty WinForms application in C# with Visual Studio. We create a folder called References and there we copy the MindFusion.*.dll -s that we will need. They are:

MindFusion.Charting.dll
MindFusion.Charting.WinForms.dll
MindFusion.Common.dll

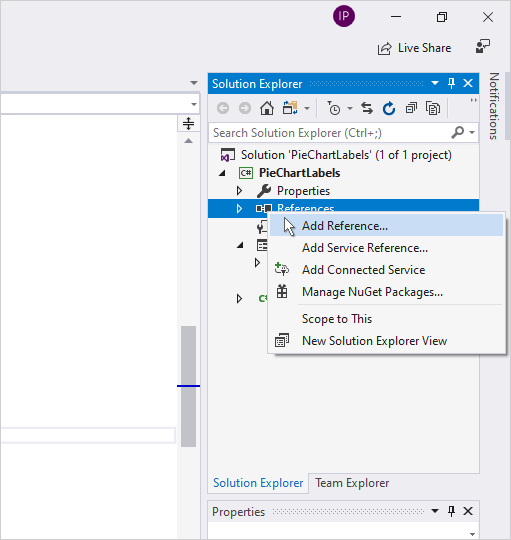
We reference those files in our project: we right-click the References folder in the Solution Explorer and click on “Add Reference”. Then we browse to our local References folder and add the 3 dll-s.

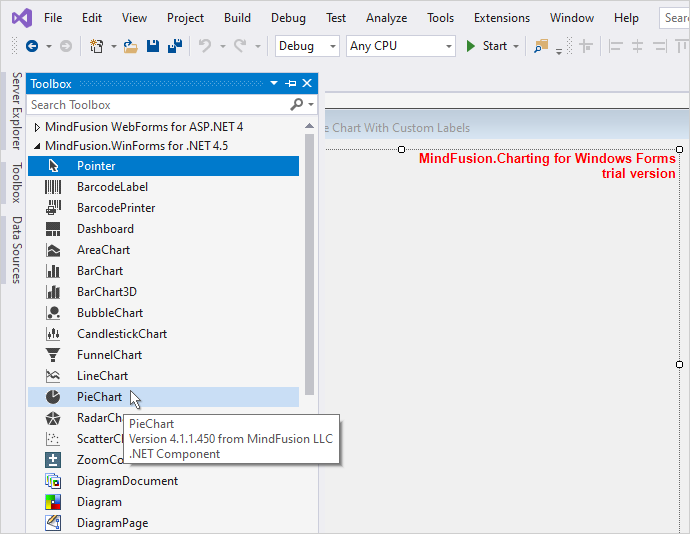
We have installed MindFusion Charts and Gauges from the website: http://mindfusion.eu/ChartWinFormsTrial.zip and now we need only to find the PieChart control, drag and drop it onto the WinForms Form of our application.

II. The Custom Pie Series

When you create a custom series you need to implement the Series interface. You need to declare several methods and properties, and one event. Let’s start with the constructor.

We need our chart to use one array with data and one array with labels. We declare two class variables for that and assign to them the values that we receive for them in the constructor. We name the new class CustomPieSeries:

public class CustomPieSeries : Series
{
	public CustomPieSeries(IList data, IList legendLabels )
	{
		values = data;		
		_legendLabels = legendLabels;

		//sum up all pie data
		total = 0.0;
		for (int i = 0; i < data.Count; i++)
			total += data[i];
	}

	IList values;	
	IList _legendLabels;
        double total = 0L;
}

We have added a new class variable called total. It is needed to keep the sum of all data for the chart. We will use this variable when we calculate the percent value of each pie piece.

The SupportedLabels property of type LabelKinds is the way to set which labels will be rendered by the new series. We want tooltips, inner labels and legend labels. There is no special enum field for legend labels. You just set which labels form the series should be rendered as legend items. We decide to use for this the ZAxisLabel, because it is not drawn anywhere on the pie chart and we won’t see it doubled by the legend labels. So, we say that the chart supports ZAxisLabels and we will tell the series that the ZAxisLabels must be rendered in the legend. We will do this later.

public LabelKinds SupportedLabels
{
	get { return LabelKinds.InnerLabel | LabelKinds.ToolTip | LabelKinds.ZAxisLabel; }
}

The GetLabel method is the place where we must return the correct label according to the type and position of the label, which are provided as arguments.

public string GetLabel(int index, LabelKinds kind)
{
	double percent = (values[index] / total) * 100;
	if (kind == LabelKinds.InnerLabel)
		return percent.ToString("F2") + "%\n" + values[index].ToString();
	if (kind == LabelKinds.ToolTip)
		return "Number of interns: " + values[index].ToString("F0") + 
			"\nPercent of total: " + percent.ToString("F2") + "%";

	if (kind == LabelKinds.ZAxisLabel)
		return _legendLabels[index].ToString();

	return null;
}

Here we have the chance to work over the raw data that we have for the series and return the desired labels as a string. We want the inner label to appear as the data value together with its percent representation. We calculate the percent thanks to the total variable and format it in an appropriate way:

 if (kind == LabelKinds.InnerLabel)
	return percent.ToString("F2") + "%\n" + values[index].ToString();

We do the same with the tooltips. We add an explanation text to the tooltip of each piece:

if (kind == LabelKinds.ToolTip)
	return "Number of interns: " + values[index].ToString("F0") + 
		"\nPercent of total: " + percent.ToString("F2") + "%";

The ZAxisLabel is the easiest to do. It will be used by the legend and we perform no special formatting upon it – we just return the label corresponding to the given index.

if (kind == LabelKinds.ZAxisLabel)
		return _legendLabels[index].ToString();

Among the other notable members of the Series interface are the Dimensions and Title properties. Dimensions is the property that specifies how many data dimensions the series has. They are 1 for charts that use one array of data, 2 for axes that use X and Y data, and 3 for 3D charts, which need X, Y and Z data. In our case we return 1 as property value because pie charts, just like radar charts, use only one data array.

public int Dimensions
{
	get { return 1; }
}

The Title property returns the Series title. This is an important property but in our case we will not use it. A common use case for Title is to be rendered in legends. We will not render the Series title in the legend, so we return an empty string.

public string Title
{
	get { return ""; }
}

Building the CustomPieSeries is an easy task:

var values = new List { 23, 54, 17, 9 };
pieChart1.Series = new CustomPieSeries(
	values,				
	new List()
	{
		" <1 month", " <=3 months", " <=6 months", " >6 months"
	}
);

We create a new instance of our new class and assign it to the Series property of the PieChart control. We provide a list with the data and the labels that we want to appear as a legend.

III. The Legend

The legend in the PieChart control is regulated by the LegendRenderer property. We set the ShowSeriesElements property to true to let the chart know that we want the data from the series to be rendered as labels and not the title:

pieChart1.LegendRenderer.ShowSeriesElements = true;

Then we use the ElementLabelKind property to specify which labels we want to use in the legend. These are the ZAxisLabels:

pieChart1.LegendRenderer.ElementLabelKind = LabelKinds.ZAxisLabel;

The other properties are self-explanatory. We use the Title property to set the legend title and set a transparent brush for both the Background and the BorderStroke = “Duration”;

pieChart1.LegendRenderer.Background = new SolidBrush(Color.Transparent);
pieChart1.LegendRenderer.BorderStroke = new SolidBrush(Color.Transparent);

IV. Styling

Styling the chart is done through the Theme property and through styles. There are different style classes available and in our case we will use the PerElementSeriesStyle class. This class accepts as arguments for the brushes and strokes lists with lists that contain the brushes. Then, it colors each element in each series with the corresponding brush in the array at the corresponding index. Our PieChart needs just one list with brushes and strokes. The stroke thicknesses are also added as nested arrays:

pieChart1.Plot.SeriesStyle = new PerElementSeriesStyle()
{
	Fills = new List<List>()
	{
		new List()
		{
			new SolidBrush(Color.FromArgb(158, 212, 224)),
			new SolidBrush(Color.FromArgb(187, 236, 247)),
			new SolidBrush(Color.FromArgb(212, 204, 196)),
			new SolidBrush(Color.FromArgb(245, 210, 179))					         }
	},

	Strokes = new List<list>()
	{
		new List()
		{
			new SolidBrush(Color.White)
						
		}
	},
	StrokeThicknesses = new List<list>()
	{
		new List()
		{
			3.0
		}
	}
};

We also set some appearance properties through the Theme field:

pieChart1.Theme.DataLabelsFontSize = 10;
pieChart1.Theme.HighlightStroke = new SolidBrush(Color.FromArgb(237, 175, 120));
pieChart1.Theme.HighlightStrokeThickness = 4;

The HighlightStroke is used to mark the selected chart element by mouse hover. The DataLabelsFontSize is used not only by painting the inner labels but also by painting the labels in the legend.

Finally we set the Title of the chart:

pieChart1.Title = "Internship Statistics";

And that is the end of this tutorial. You can download the code for the chart together with the MindFusion.*.dll libraries used from this link:

Pie Chart with Custom Labels Source Code Download

You can refer to MindFusion helpful support team with any technical questions regarding the WinForms Charts & Gauges control. Use the forum at: https://mindfusion.eu/Forum/YaBB.pl?board=mchart_disc

About MindFusion Charts and Gauges for WinForms: MindFusion Charts and Gauges for WinForms offers a long list of features that enables developer to build any type of chart, gauge or dashboard. The smart API of the library provides the option different chart elements like plots, axes, labels, and series to be combined and arranged in order to build any type of custom looking chart. The library also supports out of the box the most common chart types together with a set of their widely used properties. The gauge control is indispensable part of the library and offers a linear and oval gauge together with a variety of samples that provide you with the most common types of gauges used: clock, compass, thermometer, car dashboard and more. More about MindFusion Charts and Gauges for WinForms at: https://mindfusion.eu/winforms-chart.html.