This is a step-by-step guide that teaches you how to:
- Setup the MindFusion Scheduler for Java library to display a single
month calendar. - Attach and handle an event when the user clicks a calendar cell.
- Create and setup recurrent events/appointments.
- Perform custom drawing on a specific cell.
The sample builds a monthly calendar, which responds to a user click on a calendar cell by creating a recurrent appointment. The appointment is repeated on each subsequent day of the week for unlimited number of months.
When the user selects a given calendar cell (the 6th day of the month), a special icon appears. The icon is rendered using custom drawing.
Note: In this tutorial we use the words “appointment” and “event” interchangeably. Let’s start:
1. How to Setup the Calendar
All packages of the calendar are included in a single *.jar file – JPlanner.jar In our sample we will reference the following packages:
import com.mindfusion.common.*;
import com.mindfusion.common.Rectangle;
import com.mindfusion.drawing.*;
import com.mindfusion.drawing.awt.AwtImage;
import com.mindfusion.scheduling.*;
import com.mindfusion.scheduling.awt.*;
import com.mindfusion.scheduling.model.*;
For detailed reference about the packages and the classes of the schedule library check the online help.
Here are the first settings for our schedule:
  calendar = new AwtCalendar();
  calendar.beginInit();
  //set the current time
  calendar.setCurrentTime(DateTime.now());
  DateTime today = DateTime.today();
  //set the current date
  calendar.setDate(today);
  // Select the current date
  calendar.getSelection().set(DateTime.today());
We create a new calendar and signal that initialization starts. The time and date shown at the application start are the current date and time. We also select the cell with the current date.
Let’s make the calendar show exactly one month:
calendar.setCurrentView(CalendarView.SingleMonth);
By default each cell in a single month view has its header size set to 0, which makes the current date show in the center of the cell. As a consequence any events in the cell won’t have space to be rendered.
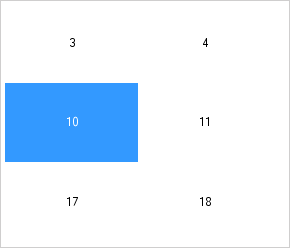
Java Scheduler: the header takes all the cell’s height
Since we plan to create appointments on user click, we must push the header to the top and free cell space for drawing the events. This is very easy to do, just set:
calendar.getMonthSettings().getDaySettings().setHeaderSize(20);
Now the header is 20 px. and the rest will be for our appointments.
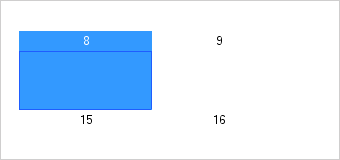
Java Scheduler: the header is 20px.
For now we are ready initializing the calendar.
calendar.endInit();
2. Handling User Clicks.
User clicks are handled with the dateClick event. We need an instance of the CalendarAdapter and there we associate the dateClick event with a method – onDateClicked. The event is fired when a date is selected.
 calendar.addCalendarListener(new CalendarAdapter(){
            public void dateClick(ResourceDateEvent e) {
                onDateClicked(e);
            }

        });
3. Create an Appointment and a Recurrence.
The first part of our event handler method is:
protected void onDateClicked(ResourceDateEvent e) {

    int dayIndex = e.getDate().getDayOfWeek();

    Appointment item = new Appointment();
    item.setStartTime(e.getDate());
    item.setEndTime(e.getDate());
    item.setHeaderText(events[dayIndex]);
    item.getStyle().setBrush(brushes[dayIndex]);
Here we create an Appointment and set its start and end date to the date which was clicked. The ResourceDateEvent keeps data about the date, the resource, if any and other useful information. The header text is the text, which will be rendered at the appointment. The style object contains appearance data for the cell and we use the setBrush
method to change the background of the appointment.
The second part of the method creates the Recurrence object:
      recurrence = new Recurrence();
      recurrence.setPattern(RecurrencePattern.Weekly);
      recurrence.setDaysOfWeek(getDayOfWeek(dayIndex));
      recurrence.setStartDate(e.getDate());
      recurrence.setRecurrenceEnd(RecurrenceEnd.Never);
      item.setRecurrence(recurrence);
The recurrence is once a week. There’s additional work to be done when we set the day of the week with setDaysOfWeek. The method accepts as an argument one of the DaysOfWeek enumeration values and we have to convert the index of the day to such value.
private int getDayOfWeek ( int i ) {

        switch (i) {
            case 1:
                return DaysOfWeek.Monday;
            case 2:
                return DaysOfWeek.Tuesday;
            case 3:
                return DaysOfWeek.Wednesday;
            case 4:
                return DaysOfWeek.Thursday;
            case 5:
                return DaysOfWeek.Friday;
            case 6:
                return DaysOfWeek.Saturday;
        }

        return DaysOfWeek.Sunday;

    }
Finally, let’s add the item with the recurrence pattern to the schedule items collection:
calendar.getSchedule().getItems().add(item);
4. Custom Drawing a Cell’s Header
The last thing that needs to be done is to draw the icon on the special 6th day of each month. We will perform item drawing and we add to the calendar initialization code this line:
calendar.setCustomDraw(CustomDrawElements.CalendarItem);
Now we are ready to handle the draw event:
   //add a listener for custom draw
       calendar.addCalendarListener(new CalendarAdapter()
        {
            @Override()
            public void draw(DrawEvent e) {
                onDraw(e);
            }
        });
Below is the first part of the handler method:
 private void onDraw(DrawEvent e)
    {
 if(e.getDate().getDay() == 6 )
            {
                java.awt.Image img = null;

                try {
                    // Read the image file from an input stream
                    InputStream is = new BufferedInputStream(
                            new FileInputStream("../cake.png"));
                    img = ImageIO.read(is);

                } catch (IOException ioe) {
                }
Here we read an image from an InputStream. The calendar method for drawing images requires mindfusion.scheduling.AwtImage and we must convert the java image:
AwtImage awtImage = new AwtImage(img);
Then we get the bounds of the drawing area and render the image:
   //gets the bounds of the drawing area
    Rectangle r = e.getBounds();

   //draw the image
   e.getGraphics().drawImage(awtImage, e.getBounds().getLeft(), e.getBounds().getTop(), 32, 32);

 }
The image is 32 x 32 pixels and gets clipped in the appointment.
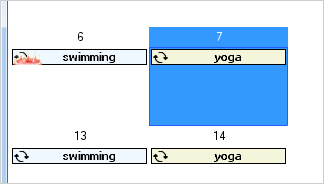
Java Scheduler: the appointment’s height is not enough.
We’ll have to resize the item header to give it more space:
calendar.getItemSettings().setSize(32);
And now everything works just fine:
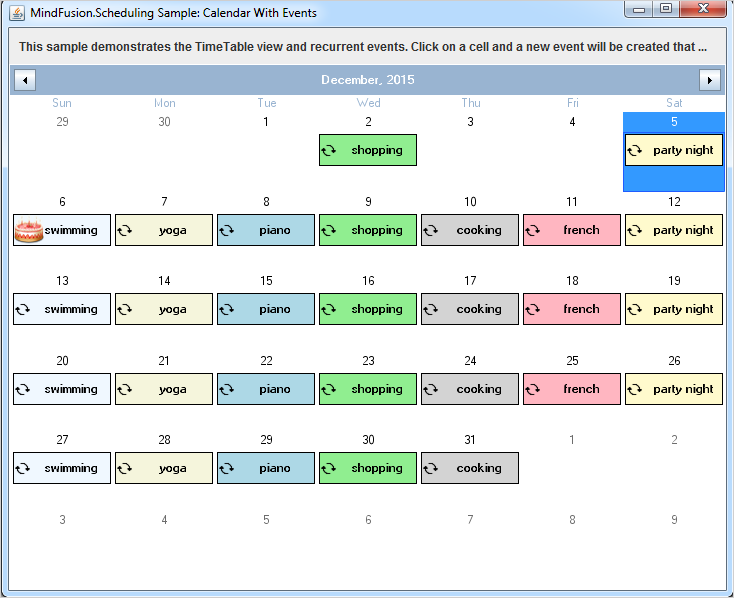
MindFusion Java Calendar: Month View with Events
The sample is available for download from here:
Monthly Calendar in Java with Recurrent Appointments and Events
About Scheduling for Java Swing: A programming class library written entirely in Java that lets you build the most sophisticated schedules, calendars and task managers fast and easy. The component boasts a comprehensive feature set that includes custom-typed events, undo/redo functionality, scrolling, tool tips and much more. You can choose among six view styles, which are easy to change and customize. The appearance of each schedule is completely customizable and supports themes, user-assigned mouse cursors and a variety of font, pen and brush options.
A detailed list with the features of the tool is available at the Scheduling for Java Swing features page. The trial version includes a variety of samples and you have plenty of sample code to study. Online documentation with useful tutorials is also available.
The library is royalty-free, source-code is also available. You can see a list of the current prices here. Check the discount page for a list of the available discounts.