Combo Chart with the Free JS Chart Library

MindFusion Free Js Chart is a charting library that enables you to create and customize the most popular chart types in pure JavaScript. The library is free for commercial use. No attribution is required.

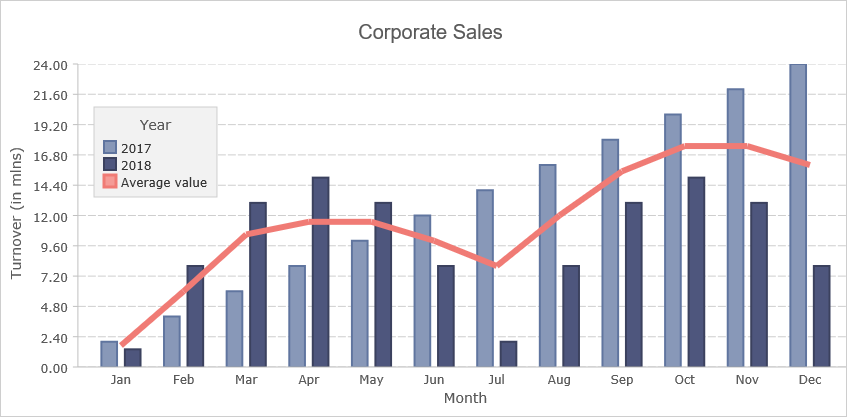
Here we will take a brief look at the steps you need to take to build this beautiful combo chart from scratch.

I. Setup

The chart needs an HTML Canvas element to render onto and we create one in our web page:

<canvas id="combiChart" width="400" height="400"></canvas>

It is important to provide an id to the Canvas element, because we will reference it from the JavaScript code.

We also need to reference the two JavaScript libraries that provide the charting functionality:

<script type="text/javascript" src="Scripts/MindFusion.Common.js"></script>
<script type="text/javascript" src="Scripts/MindFusion.Charting.js"></script>

And we add a reference to another JavaScript file, that will hold the code for the combo chart:

<script type="text/javascript" src="CombiChart.js"></script>

II. Chart Settings

We create the chart control using the HTML Element of the Canvas:

var chartEl = document.getElementById('combiChart');
chartEl.width = chartEl.offsetParent.clientWidth;
chartEl.height = chartEl.offsetParent.clientHeight;

var chart = new Controls.BarChart(chartEl);

We create a bar chart, to which we will add line rendering capabilities. It is also possible to create a line chart and add rendering of bars to it.

Next, we add a title and a grid to the chart:

chart.title = "Corporate Sales";
chart.titleMargin = new Charting.Margins(0, 20, 0, 20);
chart.gridType = GridType.Horizontal;
chart.barSpacingRatio = 1.5;

The barSpacingRatio indicates how much free space will be left between the group of bars relative to the bar width.

III. Chart Series

We create two series for the bars. Free JS Chart offers a variety of series types to choose from and we use two different series for the bars. The first one is BarSeries We use it because it supports setting the X-labels by default:

var labels = new Collections.List([
	"Jan", "Feb", "Mar", "Apr", "May", "Jun",
	"Jul", "Aug", "Sep", "Oct", "Nov", "Dec"
]);

var series1 = new Charting.BarSeries(new Collections.List([2, 4, 6,  8, 10, 12, 14, 16, 18, 20, 22, 24]), null, null, labels);

The other series of type SimpleSeries – it needs only two parameters – a list with the data and a list with the labels:

var series2 = new Charting.SimpleSeries(new Collections.List([1.4, 8, 13, 15, 13, 8, 2, 8, 13, 15, 13, 8]), null);

We don’t have labels, so we set null. Then we add the series to a collection:

var series = new Collections.ObservableCollection(new Array(series1, series2));
chart.series = series;

and assign the collection to the series property of the chart. We create the line series as an instance of the Series2D class:

//the line series
var series3 = new Charting.Series2D(new Collections.List([0, 1, 2, 3, 4, 5, 6, 7, 8, 9, 10, 11]), new Collections.List([1.7, 6, 10.5, 11.5, 11.5, 10, 8, 12, 15.5, 17.5, 17.5, 16]), null);
series3.title = "Average value";
var lseries = new Collections.ObservableCollection(new Array(series3));

We add it to another collections.

The chart renders by default bars. We will make it render a line series with the help of a LineRenderer We create an instance of the LineRenderer class and provides it with the collection of series that we want to appear as lines. In our case it is just one:

//add a renderer for the line series
var lRenderer = new Charting.LineRenderer(lseries);
lRenderer.seriesStyle = new Charting.UniformSeriesStyle(lbrush, lstroke, 6);
chart.plot.seriesRenderers.add(lRenderer);

Each chart has a plot and the plot has a SeriesRenderer property that holds all renderers for the chart data. By default, a bar chart has a BarRenderer Now we add to this collection the LineRenderer that will draw the series in lseries as lines.

IV. Legend

The chart legend is rendered when showLegend is set to true:

//legend settings
chart.showLegend = true;
chart.legendMargin = new Charting.Margins(10, 10, 10, 10);
chart.legendTitle = "Year";

We set the title of the legend to be “Year” and add some margin. The labels of the legend are taken from the title property of each Series Since the series are rendered by two different renderers we need to tell the legend which are the renders so it can take the labels from both of them and not only from the bar series. This is done with the content property of the legendRenderer:

chart.legendRenderer.content = chart.plot.seriesRenderers;

V. Styling

The styling of the Series is done with different Style instances. For the bar chart we use a PerSeriesStyle instance. It colors all elements of a given series with the respective brush and stroke in the brushes and strokes instances that were provided as parameters:

var firstBrush = new Drawing.Brush("#8898B8");
var secondBrush = new Drawing.Brush("#4E567D");
var firstStroke = new Drawing.Brush("#60759f");
var secondStroke = new Drawing.Brush("#3b415e");

 // assign one brush per series
var brushes = new Collections.List([firstBrush, secondBrush]);
var strokes = new Collections.List([firstStroke, secondStroke]); 
chart.plot.seriesStyle = new Charting.PerSeriesStyle(brushes, strokes);

We assign this style to the seriesStyle property of the plot. The line series is colored with an instance of the UniformSeriesStyle class. It applies one brush and one stroke to all elements in all series:

var lbrush = new Drawing.Brush("#F49B96");
var lstroke = new Drawing.Brush("#f07b75");

//add a renderer for the line series
var lRenderer = new Charting.LineRenderer(lseries);
lRenderer.seriesStyle = new Charting.UniformSeriesStyle(lbrush, lstroke, 6);

The third argument indicates the stroke thickness. Note that now we assign the new style to the seriesStyle property of the LineRenderer rest of the settings for the chart appearance are in the theme property:

//theme settings for customizing the chart's appearance
chart.theme.legendBackground = new Drawing.Brush("#f2f2f2");
chart.theme.legendTitleFontSize = 14;
chart.theme.legendBorderStroke = new Drawing.Brush("#cecece");

chart.theme.axisTitleFontSize = 14;
chart.theme.axisLabelsFontSize = 12;
chart.theme.axisTitleFontName = "Verdana";
chart.theme.axisLabelsFontName = "Verdana";

chart.theme.dataLabelsFontName = "Verdana";
chart.theme.dataLabelsFontSize = 12;

chart.theme.gridLineStyle = Drawing.DashStyle.Dash;
chart.theme.gridColor1 = chart.theme.gridColor2 = new Drawing.Color("#ffffff");
chart.theme.gridLineColor = new Drawing.Color("#cecece");

chart.theme.highlightStroke = new Drawing.Brush("#F49B96");
chart.theme.highlightStrokeThickness = 4;

Here we change the font for the labels, style the legend and the grid. Finally, we customize the stroke that highlights chart elements when the user hovers with the mouse over them.

And that’s the end of this tutorial. You can download the full source code of the sample with the libraries of Free JS Chart from this link: https://mindfusion.eu/samples/javascript/free_chart/CombiChart.zip

You can find out more about MindFusion Free JS Chart library at https://mindfusion.eu/free-js-chart.html.

Custom Nodes in WPF Diagram

Here we will look how to define custom diagram nodes in the WPF diagram control, how to style them, how to make their properties appear in the property grid and how to save and load them with the diagram’s saveToXml and loadFromXml methods.

Here is a screenshot of our SubjectNode custom node class that is used in an application for a school curriculum:

I. XAML Template

You will need to add a XAML template for the node us you are creating a custom node because you want to have special-looking nodes. Let’s create a node that has 3 text fields and a background. We will declare the template for this node that we call SubjectNode in XAML this way:

<style targettype="local:SubjectNode">
    <Setter Property="Template">
      <Setter.Value>
        <DataTemplate DataType="local:SubjectNode">
          <Grid>

            <Rectangle
		Stroke="{Binding Stroke}"
		Fill="{Binding Background}" />

            <Grid>              

               <StackPanel Margin="4,8,0,0"  Orientation="Vertical" Grid.Column="1">
                <TextBlock Text="{Binding Subject}" FontWeight="800" Foreground="Black" />
                <TextBlock Text="{Binding Teacher}" Foreground="Blue" />
                <TextBlock Text="{Binding Remarks}" FontSize="9" Foreground="Black" />
              </StackPanel>
            </Grid>

          </Grid>
        </DataTemplate>
      </Setter.Value>
    </Setter>
  </style>

That goes in the contents of <ResourceDictionary>…..</ResourceDictionary> in the xaml file where you store this resourrce dictionary.

You see here that we use a gird as the principal layout container. There we add a rectangle, whose Fill property is bound to a property called Background in the SubjectNode. Next we have another grid that holds a StackPanel. The stack panel is with vertical orientation and it arranges the three TextBlock-s for the three custom fields of the node.

II. Declaring the Custom Node Class

When you create a custom node you need to inherit the TemplatedNode class. In the static construcotr you should call OverrideMetadata on the DefaultStyleKeyProperty to make it use the template that we’ve declared in XAML:

public class SubjectNode : TemplatedNode
{
	static SubjectNode()
	{
		DefaultStyleKeyProperty.OverrideMetadata(
			typeof(SubjectNode), new FrameworkPropertyMetadata(typeof(SubjectNode)));
}

public SubjectNode()
{			
}

Then we declare a constructor without any parameters that is required for the node to be created in XAML. If you want users to be able to create instance of the SubjectNode through drag and drop, you need to declare one more constructor:

	// Required for creating nodes by dragging them from the NodeListView
public SubjectNode(SubjectNode prototype) : base(prototype)
{
	Subject = prototype.Subject;
	Teacher = prototype.Teacher;
	Remarks = prototype.Remarks;
}

III. Properties

We declare the properties that we want: Subject, TeacherName, Remarks and Background as dependency properties the standard way:

public Brush Background
{
	get { return (Brush)GetValue(BackgroundProperty); }
	set { SetValue(BackgroundProperty, value); }
}

public static readonly DependencyProperty BackgroundProperty = DependencyProperty.Register(
	"Background",
	typeof(Brush),
	typeof(SubjectNode),
	new PropertyMetadata(new SolidColorBrush(Color.FromRgb(223, 235, 250))));

and for the text properties:

public string Remarks
{
	get { return (string)GetValue(RemarksProperty); }
	set { SetValue(RemarksProperty, value); }
}

public static readonly DependencyProperty RemarksProperty = DependencyProperty.Register(
	"Remarks",
	typeof(string),
	typeof(SubjectNode),
	new PropertyMetadata(""));

If we want the properties to be listed in a property grid we need to add a new class that inherits from DiagramNodeProperties. In it we do nothing but list the custom properties together with their type:

public class SubjectNodeProperties : DiagramNodeProperties
{
        internal string Subject;
	internal string Teacher;
	internal string Remarks;
	internal Brush Background;
} 

IV. More Options

Standard diagram nodes support undo and redo as well serialization out of the box. If you want your custom class to support those features as well you need to implement a few more methods. The methods to support undo/redo are SaveProperties and RestoreProperties. They take an instance of the DiagramItemProperties class that allows you to transfer data between the instance of the current node and its DiagramItemProperties instance that store the values of the node’s properties:

protected override void RestoreProperties(DiagramItemProperties props)
{
	base.RestoreProperties(props);
	var state = (SubjectNodeProperties)props;
	Subject = state.Subject;
	Teacher = state.Teacher;
	Remarks = state.Remarks;
	Background = state.Background;
}

protected override void SaveToXml(XmlElement xmlElement, XmlPersistContext context)
{
	base.SaveToXml(xmlElement, context);
	context.WriteString(Subject, "Subject", xmlElement);
	context.WriteString(Teacher, "Teacher", xmlElement);
	context.WriteString(Remarks, "Remarks", xmlElement);
	context.WriteBrush(Background, "Background", xmlElement);
}

The Diagram uses XML for serialization, so if you want your node to be saved and loaded correctly through the Diagram‘s saveToXml and loadFromXml methods you should implement SaveToXml and LoadFromXml. There you write the values o the custom properties of SubjectNode to XML elements and read them from XML elements as well:

protected override void SaveToXml(XmlElement xmlElement, XmlPersistContext context)
{
	base.SaveToXml(xmlElement, context);
	context.WriteString(Subject, "Subject", xmlElement);
	context.WriteString(Teacher, "Teacher", xmlElement);
	context.WriteString(Remarks, "Remarks", xmlElement);
	context.WriteBrush(Background, "Background", xmlElement);
}

protected override void LoadFromXml(XmlElement xmlElement, XmlPersistContext context)
{
	base.LoadFromXml(xmlElement, context);
	Subject = context.ReadString("Subject", xmlElement);
	Teacher = context.ReadString("Teacher", xmlElement);
	Remarks = context.ReadString("Remarks", xmlElement);
	Background = context.ReadBrush("Background", xmlElement);
}

You can download the sample that uses custom SubjectNode from https://mindfusion.eu/samples/wpf/diagram/Curriculum.zip

About Diagramming for WPF: This is the right tool to create flowcharts in WPF that always meet your requirements. The library offers more than 100 predefined node shapes, extensive event set and more than 15 exporters and importers. Each diagram that you build has a completely customizable look through styles, themes and appearance properties for each part of the flowchart. The numerous samples and detailed documentation help you learn quickly how to integrate the component into your own application. You can download the trial version, which has no feature restrictions and does not expire from the WPF Diagram Page on MindFusion website.

New Release for the Free JS Chart Library

MindFusion Free JS Chart has a new release with the following new features:

– All Series can accept now simple JavaScript array-s as arguments instead of Collections.List instances
– The ToolTip class is greatly extended with many new properties that allow you to customize the apparance and position of tooltips
– The Color.knownColors field lists all standard CSS color names
– Brush and Pen instances can be created with simple strings that specify the HTML code of the color as argument instead of Color objects.
– The yLabelAlignment property of BiaxialChart specifies horizontal alignment of Y-axis labels.
– Texts are now properly underlined when FontStyle.Underline is set.

Free JS Chart is MindFusion charting library that is offered free of charge for commercial use. No attribution is required.

More about MindFusion Free JS Chart at https://mindfusion.eu/free-js-chart.html

Appointment Scheduler in JavaScript

In this blog post we will build from scratch an appointment schedule for 4 practitioners. Each appointment is logged with the patient name and contact details. Each appointment can be scheduled in one of 4 rooms. We will also implement a check to see if the room that we want to assign to an appointment is free at the particular time.

You can run the sample online from the link below:

I. Project Setup

The first thing we’ll do is to create a DIV element and assign it an id. The JS Schedule library needs and HTML div element where the timetable will be rendered. We create one:

<div id="calendar" style="height: 100%;width: 100%"></div>

You can position the div element wherever you wish. It’s location and size determine the location and the size of the schedule.

Next, we need to reference the Schedule library file. It is called MindFusion.Scheduling. We reference it at the end of the web page, right after the closing BODY tag:

<script src="scripts/MindFusion.Scheduling.js" type="text/javascript"></script>
<script src="AppointmentSchedule.js" type="text/javascript"></script>

We will write the JavaScript code for the appointment schedule in a separate JS file, which we call AppointmentSchedule. We have added a reference to it as well.

II. Schedule Settings

In the JavaScript code behind file we first create a mapping to the MindFusion.Scheduling namespace and a reference to the Intellisense file:

/// 

var p = MindFusion.Scheduling;

Next, we use the id of the DIV element to create an instance of the Calendar class:

// create a new instance of the calendar
calendar = new p.Calendar(document.getElementById("calendar"));

We set the currentView property of the calendar to CalendarView Timetable:

// set the view to Timetable, which displays the allotment 
// of resources to distinct hours of a day
calendar.currentView = p.CalendarView.Timetable;

We use the timetableSettings property to specify the time range for each day. The starttime and endTime properties set exactly the begin and end of the time interval rendered by the timetable columns. They are measured in minutes, from midnight of the day they refer to. We want the schedule to start from 7 A that is why we set 420 as value to the startTime property – the minutes in 7 hours.

calendar.timetableSettings.startTime = 420;
calendar.timetableSettings.endTime = 1260;

The titleFormat property specifies how the date at each timetable column will be rendered. The format string follows the standard date and time pattern for JavaScript:

calendar.timetableSettings.titleFormat = "dddd d MMM yyyy";
calendar.itemSettings.tooltipFormat = "%s[hh:mm tt] - %e[hh:mm tt] %h (Contact: %d)";

The tooltipFormat follows a custom formatting pattern, used by Js Scheduler. It supports special format strings like:

  • %s for start time
  • %e for end time
  • %h for header e.g. the text of the item header
  • %d for description: the text that was assigned as a description of the appointment.

III. Contacts, Locations and Grouping

The 4 practitioners are instances of the Contact class:

resource = new p.Contact();
resource.firstName = "Dr. Lora";
resource.lastName = "Patterson";
resource.tag = 2;
calendar.schedule.contacts.add(resource);

It is important to add them to the contacts property of the schedule. The rooms where the appointments take place are Location instances:

resource.name = "Room 112";
calendar.schedule.locations.add(resource);

The grouping of the data that is rendered by the timetable is done is a method called group:

function group(value) {
	calendar.contacts.clear();
	if (value == p.GroupType.GroupByContacts) {
		// add the contacts by which to group to the calendar.contacts collection
		calendar.contacts.addRange(calendar.schedule.contacts.items());
	}
	calendar.locations.clear();
	if (value == p.GroupType.GroupByLocations) {
		// add the locations by which to group to the calendar.locations collection
		calendar.locations.addRange(calendar.schedule.locations.items());
	}
	calendar.groupType = value;
}

When we’ve created the locations and contacts, we added them to the locations and contacts collections of the schedule property of the Calendar . Grouping of the appointments is done based on the contacts and locations collections of the Calendar (not the schedule ). That is why in the group method we clear the data from the respective collection and add to it all data from the corresponding collection in the schedule Of course, we must set the groupType property to the appropriate GroupType value.

IV. Appointments

When the user selects a range of cells the new Appointment dialog appears automatically. There they can enter all necessary data. We want to implement check if a given room is free when the user tries to create a new appointment in this room. We will do the check in the handler of the itemCreating event. The itemCreating event is raised when the new item has not been ready yet and the ItemModifyingEventArgs object that is provided to the event handler gives the opportunity to cancel the event:

calendar.itemCreating.addEventListener(handleItemCreating);

function handleItemCreating(sender, args)
{
	var appLocation = args.item.location;
	
	if(appLocation != null )
	{
		if(appLocation.name != "")
		{
			var items = calendar.schedule.items.items();
			for(var i = 0; i < calendar.schedule.items.count(); i++)
			{
				if( items[i].location == null)
					continue;
				
				//if the location is the same as the location of another appointment
				//at that time we cancel the creating of the appointment
				if( items[i].location.name == appLocation.name && 
				overlappingAppointments (args.item, items[i]))
				{
					args.cancel = true;
					alert("The room is already taken");
				}
	
			}
		}
	}
}

We use a helper method called overlappingAppointments, whose only task is to compare the time range of two items and return true if their time span overlaps – entirely or partially.

/* checks if the time allotted to two different appointments overlaps */
function overlappingAppointments(item1, item2)
{
	if( item1.startTime < item2.startTime &&
	    item1.endTime < item2.endTime )
		  return false;
		  
	if( item1.startTime > item2.endTime &&
	    item1.endTime > item2.endTime )
		  return false;	
		  
		  return true;	  		
}

V. Timeline

Our timetable renders one day at a time. When the user wants to add an appointment that is due in 10 days, they will need to do a lot of scrolling. We can solve the problem by adding a date list at the top o the timetable. The list is another Calendar instance and but its currentView is set to CalendarView List.

We first need to add another DIV element that will be used by the constructor of the new Calendar:

Then we create new Calendar object and make it render a list with dates:

datePicker = new p.Calendar(document.getElementById("datePicker"));
datePicker.currentView = p.CalendarView.List;

By default each Calendar renders the current date when it starts. We make it display a succession of 30 days. We want each day to have a prefix that indicates its week day. In addition, we hide the header of the calendar and stop the default “New Appointment” form from rendering when the user clicks on a cell:

datePicker.listSettings.visibleCells = datePicker.listSettings.numberOfCells = 30;
datePicker.listSettings.headerStyle = p.MainHeaderStyle.None;
datePicker.listSettings.generalFormat = "ddd d";
datePicker.useForms = false;

How do we “wire” the selected date in the timeline to the active date in the timetable? We handle the selectionEnd event and there we assign the selected date from the timeline as the active date of the timetable:

function handleSelectionEnd(sender, args) {
	var startDate = args.startTime;
	var endDate = args.endTime;

	// show the selected date range in the timetable
	calendar.timetableSettings.dates.clear();
	while (startDate < endDate) {
		calendar.timetableSettings.dates.add(startDate);
		startDate = p.DateTime.addDays(startDate, 1);
	}
}

A timetable renders those dates, that are added to its dates property. We add just one date – the date that was selected in the list.

Let’s not forget to call the render method once we’ve finished all customizations on both Calendar render the calendar control

calendar.render();
//render the timeline control
datePicker.render();

VI. Styling

The general styling of the two Calendar instances is done with one of the predefined themes of the Js Scheduler library. First, we need to add a reference to the CSS file, where it is defined. We’ve chosen the “pastel” theme, which is defined in pastel.css:


Then we need only to set its name as a plain string to the theme property of the two Calendar instances:

calendar.theme = "pastel";
datePicker.theme = "pastel";

There is one more styling that we want to do: we want the appointments of each practicioner to be colored in a different color. We inspect the styling o the appointment element in the browser and find out that the styling of the items is set by the class mfp-item. We create 4 different sub-classes of mfp-item for the 4 practitioners:

.itemClass0 .mfp-item
		{
			background-color: #03738C !important;
			color: #fff !important;
		}
		.itemClass1 .mfp-item
		{
			background-color: #03A6A6 !important;
			color: #fff !important;
		}
..............

Then we need to assign the correct class to the appointments. We will do this with the cssClass property of Item We handle the itemCreated event where we get information for the appointment that was created:

calendar.itemCreated.addEventListener(handleItemCreated);

function handleItemCreated(sender, args)
{
	var contact = args.item.contacts.items()[0];
	
	if(contact != null )
		args.item.cssClass = "itemClass" + contact.tag;

}

The easiest way to assign the correct CSS class to the item is to assign data that will help us generate the correct style name. We use the tag property of Contact and assign each practitioner an id that mirrors the last letter in the CSS class we should assign to the appointments associated with this contact.

With that our appointment application is finished. You can download the full source code with the libraries and styles used from this link:

Appointment Schedule in JavaScript: Source Code Download

About MindFusion JavaScript Scheduler: MindFusion Js Scheduler is the complete solution for all applications that need to render interactive timetables, event schedules or appointment calendars. Fully responsive, highly customizable and easy to integrate, you can quickly program the JavaScript scheduling library according to your needs. Find out more at https://mindfusion.eu/javascript-scheduler.html

Combination Chart in JavaScript

In this blog post we will use the Charting for JavaScript library to create the chart that you see below:

This is a combination chart has one line series and two bar series drawn in stacks. We will use the Dashboard control to combine the building elements of the chart: data series, legend, axes, title and plot.

I. HTML Setup

We need an HTML Canvas element for the chart to draw itsself onto. It is important that we give it an id. The Canvas element will render the chart and its position and size will determine where and how big the chart will be drawn.

<canvas id="dashboard" style="width: 100%; height: 100%; display: block;"></canvas>

The Dashboard control needs the MindFusion.Charting.js library. We also need the MindFusion.Drawing module for presentation classes like brushes, pens etc. We include reference to these files at the end of the web page, before the closing BODY tag:

<a href="http://Scripts/MindFusion.Common.js">http://Scripts/MindFusion.Common.js</a>
<a href="http://Scripts/MindFusion.Charting.js">http://Scripts/MindFusion.Charting.js</a>

The two library JavaScript files are in a subfolder called Scripts. We prefer to keep the JavaScript code for the combination chart separate from the web page and we include one final JS reference:

<a href="http://CombinationChart.js">http://CombinationChart.js</a>

This is the code-behind file where we will write all code that creates and customizes the combination chart.

II. Creating the Dashboard and General Chart Settings

We add mappings to the chart and drawing namespaces that we want to use. If your IDE supports Intellisense you can also add a reference to the Intellisense file.

/// 
var Charting = MindFusion.Charting;

var Controls = Charting.Controls;
var Collections = Charting.Collections;
var Drawing = Charting.Drawing;
var Components = Charting.Components;

The Dashboard class requires and HTML element in the constructor. We get the Canvas from the web page with the help of its id:

// create the dashboard
var dashboardEl = document.getElementById('dashboard');
dashboardEl.width = dashboardEl.offsetParent.clientWidth;
dashboardEl.height = dashboardEl.offsetParent.clientHeight;
var dashboard = new Controls.Dashboard(dashboardEl);

The Dashboard control is a container for all elements of a dashboard. In order to render a chart, we need a Plot element that can visualize data. We create an instance of the Plot2D class:

var plot = new Charting.Plot2D();
plot.gridType = Charting.GridType.Horizontal;
plot.gridColor1 = plot.gridColor2 = new Drawing.Color.fromArgb(200, 243, 244, 254);

Then we specify that the plot will render a horizontal grid with light gray grid lines. Each Plot2D has a seriesRenderers property that stores all -SeriesRenderer -s that are responsible for drawing correctly the data series according to their type – LineSeries BarSeries PieSeries etc. More about that later.

III. Data Series and Renderers

Each data series is represented by a class that corresponds to its type. MindFusion Charting for JavaScript has a variety of ISeries classes, some of whom can be used in different chart types. We will first use the BarSeries class to create one of the series that render bars:

// data for first bar series
var barSeries1 = new Charting.BarSeries(
		new Collections.List([9, 11, 13, 18, 19, 22, 23, 26, 29, 32, 33, 36, 41, 46, 49, 55, 57, 58, 61, 63]), //y
		null, null,
		new Collections.List(["1999", "2000", "2001", "2002", "2003", "2004", "2005", "2006", "2007", "2008", "2009", "2010", "2011", "2012", 
		"2012", "2013", "2014", "2015", "2016", "2017", "2018"]));

The BarSeries constructor requires several arguments. The first one is the data list, the second are lists with the top and inner labels, which we do not use. The last parameter are the labels for the X-axis and we set here the desired labels.

Then we set the title property of the BarSeries – it is important because it will render as a legend item.

barSeries1.title = "Total amount of goods sold";

We create then another series for the top row of bars. We don’t need any labels any more so we use now a simple Series2D instance:

var barSeries2 = new Charting.Series2D(
		new Collections.List([1, 2, 3, 4, 5, 6, 7, 8, 9, 10, 11, 12, 13, 14, 15, 16, 17, 18, 19, 20]),//x
		new Collections.List([3, 4, 5, 5, 7, 8, 7, 6, 8, 15, 17, 21, 19, 18, 17, 16, 17, 19, 20, 22]),//y
		null);

barSeries2.title = "Extra production to meet demand";

The series need a SeriesRenderer that can draw them. There are different SeriesRenderer -s for the different types of series. The different SeriesRenderer instances support different ISeries classes.

In our case we want a stack bar chart and we use the BarStackRenderer . Each SeriesRenderer accepts a list with the Series instances it must render. Here is the code for the stack bars:

// draw bars
var barRenderer = new Charting.BarStackRenderer(new Collections.ObservableCollection([barSeries1, barSeries2]));
barRenderer.seriesStyle = new Charting.PerSeriesStyle (new Collections.List([new Drawing.Brush("#230A59"), new Drawing.Brush("#3E38F2")]));
barRenderer.barSpacingRatio = 0.7;

The different SeriesRenderer instances have different sets of properties that allow you to customize how the data series will be drawn. Here we use the barSpacingRatio to specify the thickness of the stack bars.

As we mentioned earlier, the Plot2D class has a seriesRenderers property where we can add the different SeriesRenderer -s that we want to show. We add the BarStackRenderer add graphics to plot
plot.seriesRenderers.add(barRenderer);

The procedure is the same for the line chart. We create another Series2D instance:

// sample data for line graphics
var lineSeries = new Charting.Series2D(
				new Collections.List([0, 1, 2, 3, 4, 5, 6, 7, 8, 9, 10, 11, 12, 13, 14, 15, 16, 17, 18, 19]),//x
				new Collections.List([7, 9, 12, 15, 18, 23, 24, 27, 35, 41, 46, 49, 53, 55, 58,  61, 63, 66, 67, 69 ]),//right-y
				null);
lineSeries.title = "Peak demand";

We give it a title and create a LineRenderer that will render this series:

// draw lines
var lineRenderer = new Charting.LineRenderer(
				new Collections.ObservableCollection([lineSeries]));
lineRenderer.seriesStyle = new Charting.UniformSeriesStyle(new Drawing.Brush("#ffffff"), new Drawing.Brush("#ffffff"), 6);

Finally we add the LineRenderer to the seriesRenderers collection of the Plot2D instance.

plot.seriesRenderers.add(lineRenderer);

You might have noticed that we also set the seriesStyle property in both the BarStackRenderer and the LineRenderer classes. This is the property that specifies how the chart series will be painted. There are different classes that derive from SeriesStyle All of them concern a different pattern of applying brushes and pens to the element of a Series We use here an instance of the PerSeriesStyle class that accepts lists with brushes and strokes and applies one consequtive brush and stroke to all elements in the corresponding Series . The LineRenderer uses the UniformSeriesStyle , which accepts just two Brush instances as arguments and applies them to fill and stroke all elements in all Series instances in the SeriesRenderer .

IV. The Axes

The chart axes are instances of the Axis class. We use their min , max and interval properties to specify the numeric data of each of the two axes that our dashboard will have – X and Y:

// create axes
var xAxis = new Charting.Axis();
xAxis.interval = 0;
xAxis.minValue = -1;
xAxis.maxValue = 20;
xAxis.title = "";

// create axes
var yAxis = new Charting.Axis();
yAxis.interval = 10;
yAxis.minValue = 0;
yAxis.maxValue = 100;
yAxis.title = "Cost of goods in mlns of USD";

Then we specify to the Plot2D that the Axis instances we created are its X and Y axes:

plot.yAxis = yAxis;
plot.xAxis = xAxis;

As you might have guessed, the Axis need Renderer-s to render them. They are called respectively XAxisRenderer and YAxisRenderer .

// create renderers for the two axes
var xAxisRenderer = new Charting.XAxisRenderer(xAxis);
xAxisRenderer.margin = new Charting.Margins(0, 0, 0, 10);
xAxisRenderer.labelsSource = plot;
xAxisRenderer.showCoordinates = false;


var yAxisRenderer = new Charting.YAxisRenderer(yAxis);
yAxisRenderer.margin = new Charting.Margins(10, 0, 0, 0);

The renderers have various properties for specifying how the axes will be rendered. We use margin to add some space around the two axes.

Finally, we use the layoutBuilder property of the Dashboard class to create a GridPanel that will correctly measure and arrange all building blocks of our cobination chart:

dashboard.layoutBuilder.createAndAddPlotAndAxes(
		plot, null,
		[yAxisRenderer],
		[ xAxisRenderer ],
		null);

V. The Legend

As we said, the legend items are taken from the title property of each Series . We use a LegendRenderer to render the legend and set some of its properties:

// add legend
var legendRenderer = new Charting.LegendRenderer();
legendRenderer.content = new Collections.ObservableCollection([barRenderer, lineRenderer]);
legendRenderer.background = new Drawing.Brush("#d0d3fb");
legendRenderer.borderStroke = new Drawing.Brush("#BDBFAA");
legendRenderer.showTitle = false;
legendRenderer.horizontalAlignment = Components.LayoutAlignment.Far;

The content property of LegendRenderer allows us to specify a collection of SeriesRenderer instances. This way we can have one legend for series of different kinds. We don’t need a title for our legend, so we set showTitle to false.

The LegendRenderer requires no special positioning in the dashboard layout, so we simple add it to the rootPanel of the Dashboard and let it handle its easure and placement:

dashboard.rootPanel.children.add(legendRenderer);

VI. The Title and Subtitle

The title is an instance of the TextComponent class:

var tc = new Components.TextComponent();
tc.text = "STEADY GROWTH";
tc.fontSize = 20.4;
tc.horizontalAlignment = Components.LayoutAlignment.Near;
tc.margin = new Charting.Margins(100, 10, 0, 0);
dashboard.layoutPanel.children.add(tc);

It has various appearance properties. Just like the LegendRenderer the TextComponent can be added directly to the children of the layoutPanel.

Now that we’ve made all arrangements for the chart let’s not forget to call the draw method that will render the chart on the screen:

dashboard.draw();

That was everything. You can see an online demo of the chart here.

You can download the full source code of this combination chart in JavaScript together with all used libraries from here:

Combination Chart in JavaScript Full Code

About Charting for JavaScript: MindFusion library for interactive charts and gauges. It supports all common chart types including 3D bar charts. Charts can have a grid, a legend, unlimitd number of axes and series. Scroll, zoom and pan are supported out of the box. You can easily create your own chart series by implementing the Series interface.
The gauges library is part of Charting for JavaScript. It supports oval and linear gauge with several types of labels and ticks. Various samples show you how the implement the gauges to create and customize all popular gauge types: car dashboard, clock, thermometer, compass etc. Learn more about Charting and Gauges for JavaScript at https://mindfusion.eu/javascript-chart.html.